SPLUNK Lab: Brute Force and Unauthorized Login Detection
In this blog, we will simulate a brute-force attack in an Active Directory lab using Kali Linux, detect the activity in Splunk using Windows Security logs, create detection queries for failed and successful logins, and convert those queries into scheduled alerts for early detection and monitoring. and finally verifying if our alerts do detect by attacking again.
LAB SET UP: Windows 10, Domain Controller (DC), Splunk, Kali Linux
Attack Simulation
Before brute-forcing, I performed a scan to confirm the required port was open.
Brute force attacks are noisy and easily detectable, but they are still widely used in real environments. I used netexec to brute-force SMB authentication because RDP is often disabled by default, while SMB is commonly enabled in Active Directory environments.
1
netexec smb 10.0.2.13 -u Billy -p /usr/share/wordlists/rockyou.txt -d BLUE.local
Command Breakdown netexec → offensive networking/authentication tool smb → attempts SMB authentication -u Billy → target username -p rockyou.txt → password wordlist -d BLUE.local → target domain
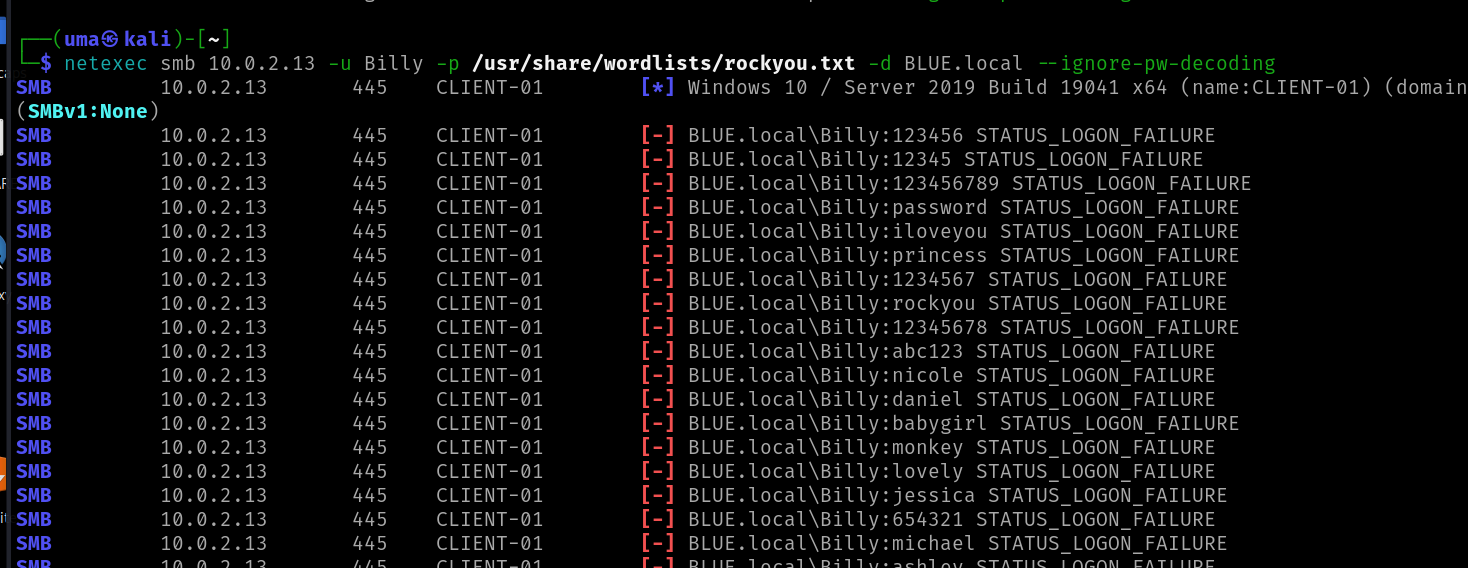
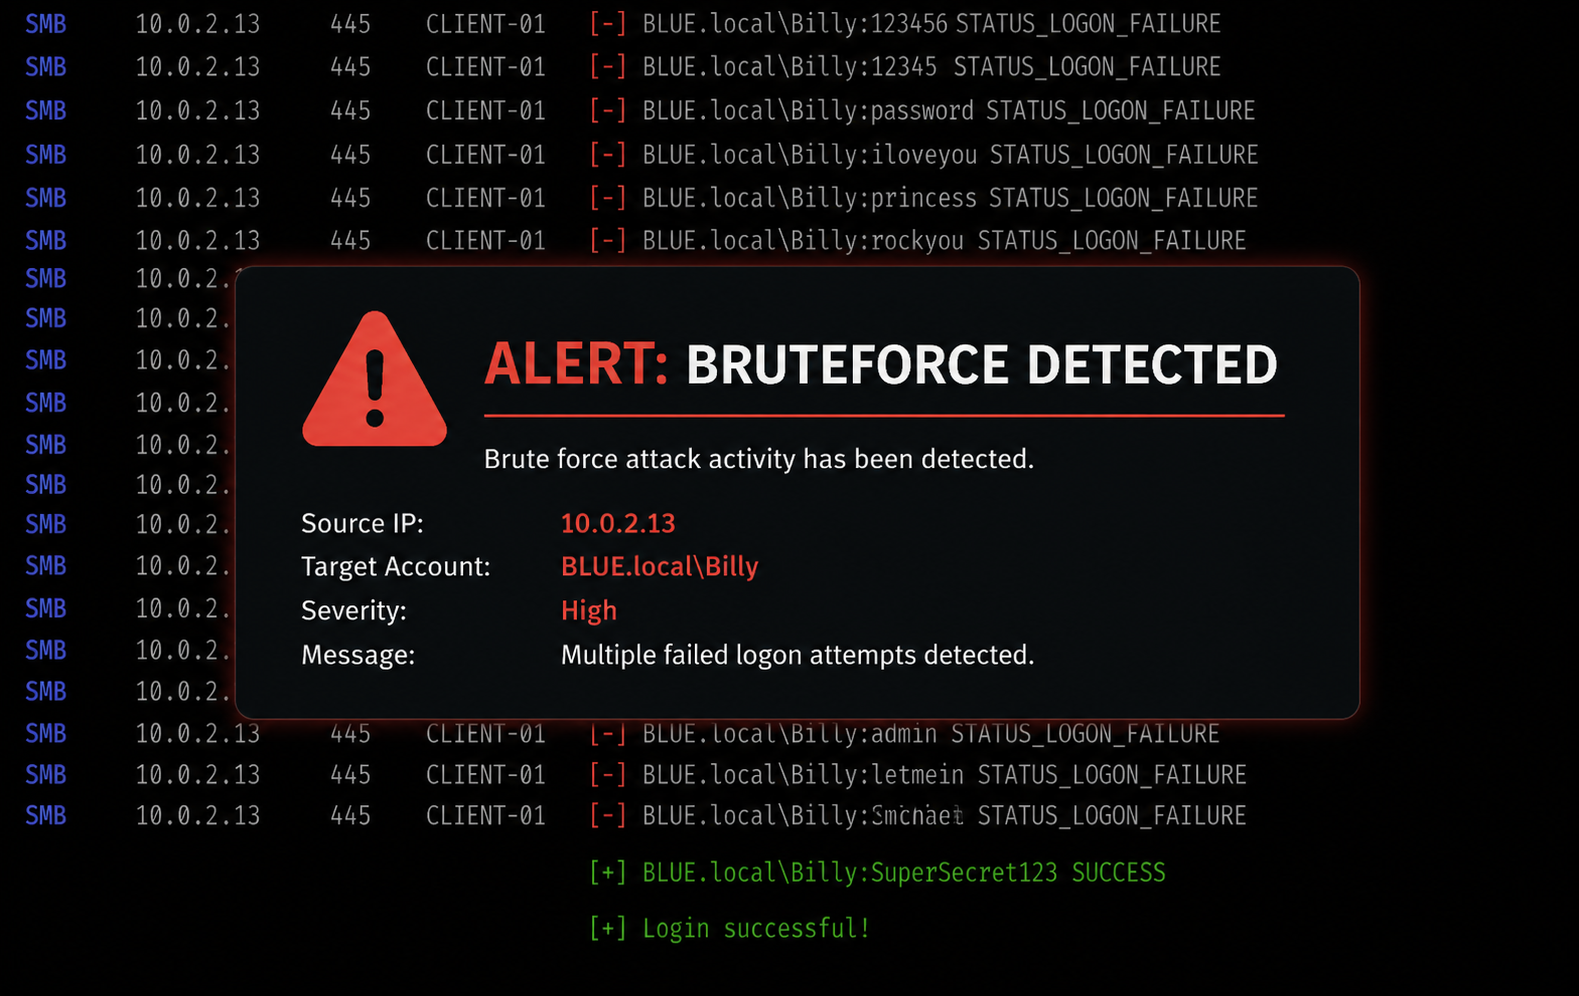
Within seconds, the tool generated a very high number of authentication attempts.
Eventually, valid credentials were discovered.
Detection in Splunk
Brueforce
Open Splunk and click on “Search & Reporting”. select the appropriate time range, Since I already knew the target host, I included it in the search.
1
2
index=windows host="Client-01" sourcetype="WinEventLog:Security" EventCode=4625
| stats count by Account_Name, Source_Network_Address, Failure_Reason
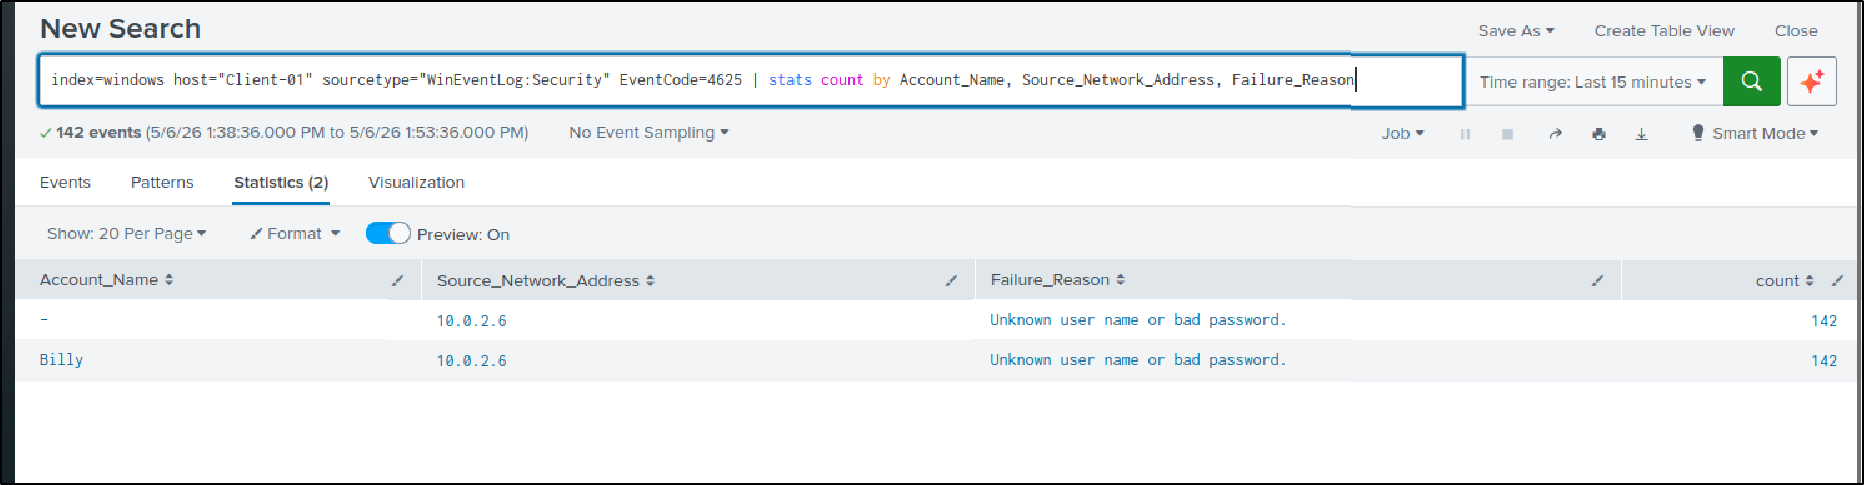
With this query, we observed 142 failed logon attempts within a very short period of time against the Billy account from 10.0.7.6, which is highly suspicious
Successful Login
A brute-force attack main goal is to gain Valid credentials which gives access to attackers
So after identifying repeated failed logins, the next step is checking whether the attacker eventually gained access to Billy user account from this IP 10.0.7.6.
Successful logons generate: Event ID 4624
1
2
index=windows host="Client-01" sourcetype="WinEventLog:Security" EventCode=4624 Account_Name!="*$" Account_Name!="ANONYMOUS LOGON" Source_Network_Address="10.0.2.6"
| table _time Account_Name Source_Network_Address Logon_Type
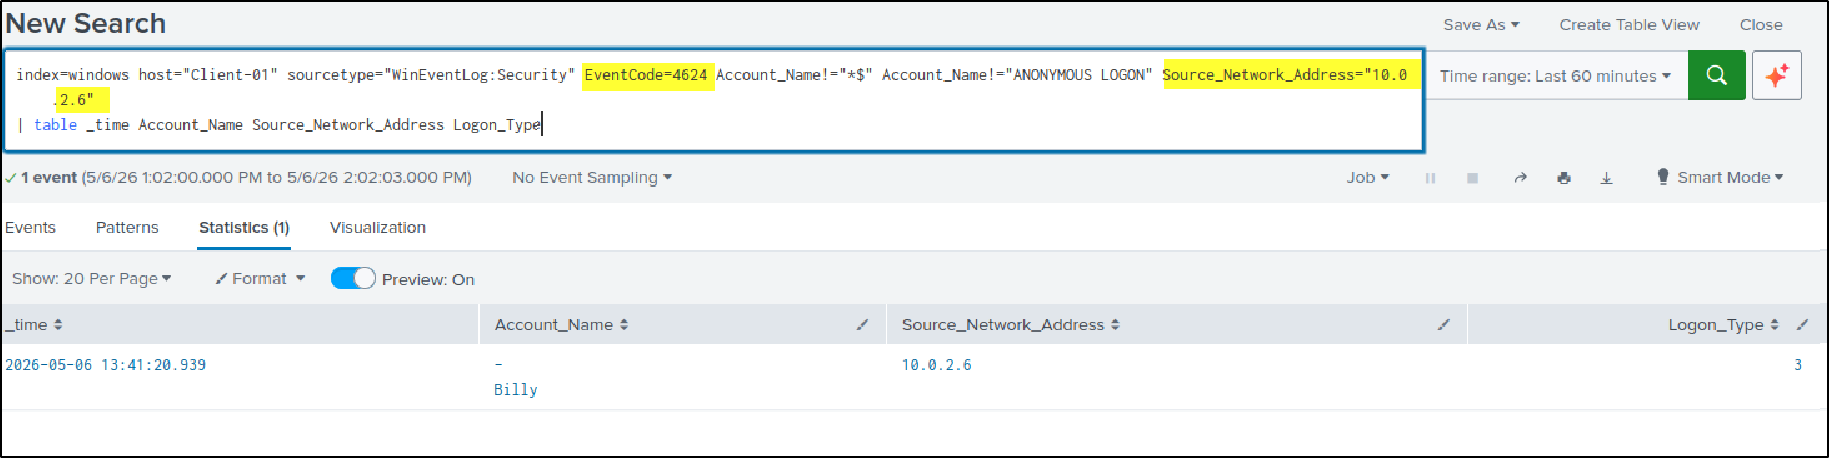
The Event shows that the attacker successfully authenticated to the Billy account from 10.0.2.6 at this time, confirming that the brute-force attack eventually succeeded. The Logon_Type value 3 indicates a network logon, commonly associated with SMB authentication.
Why Detection Rules and Alerts Matter
Above, we detected a brute-force attack against a single user from the same IP address. However, we already knew the attack happened because we performed it ourselves. In real-world environments, security analysts do not know when attackers or APT groups perform malicious activities.
Instead, defenders create detection rules to identify suspicious or malicious behavior automatically. When incoming events match those rules, the SIEM generates an alert.
After an alert is triggered, analysts begin the investigation.
Creating Alerts in Splunk
In Splunk, we create detections using SPL (Search Processing Language) queries. Unlike Sigma or Wazuh rules, Splunk detections are typically written directly as SPL searches. When the query conditions are met, Splunk can generate an alert automatically.
For larger environments and broader detection coverage:
- remove host-specific filters to monitor all systems
- detect brute-force attempts based on threshold counts
- monitor logins from unknown or unauthorized IP addresses
So, based on above ideology, let’s create queries to detect this activity if it happens again.
Rule 1 — Brute Force Detection
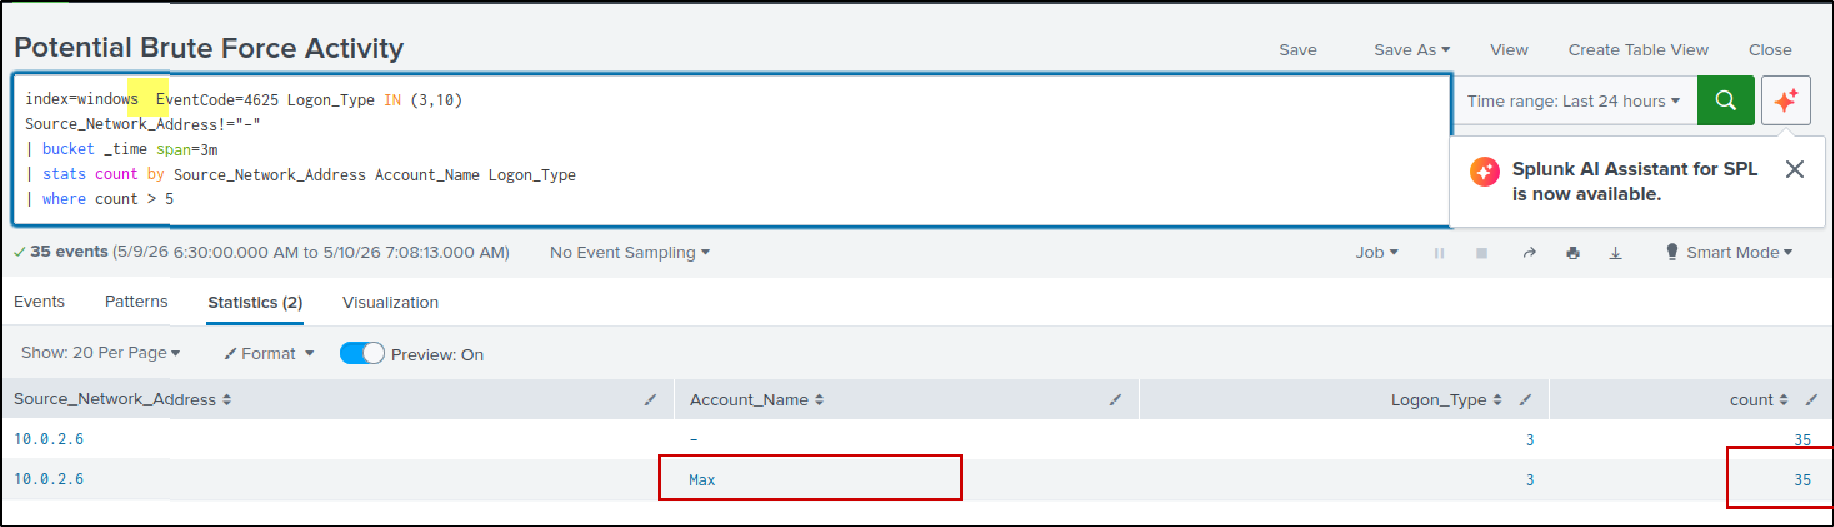
This query detects if ther are more than 5 failed login attempts within 3 minutes from the same IP against a user account
1
2
3
4
5
index=windows sourcetype="WinEventLog:Security" EventCode=4625 Logon_Type IN (3,10)
Source_Network_Address!="-"
| bucket _time span=3m
| stats count by Source_Network_Address Account_Name Logon_Type
| where count > 5
Rule2: Unauthorized Access
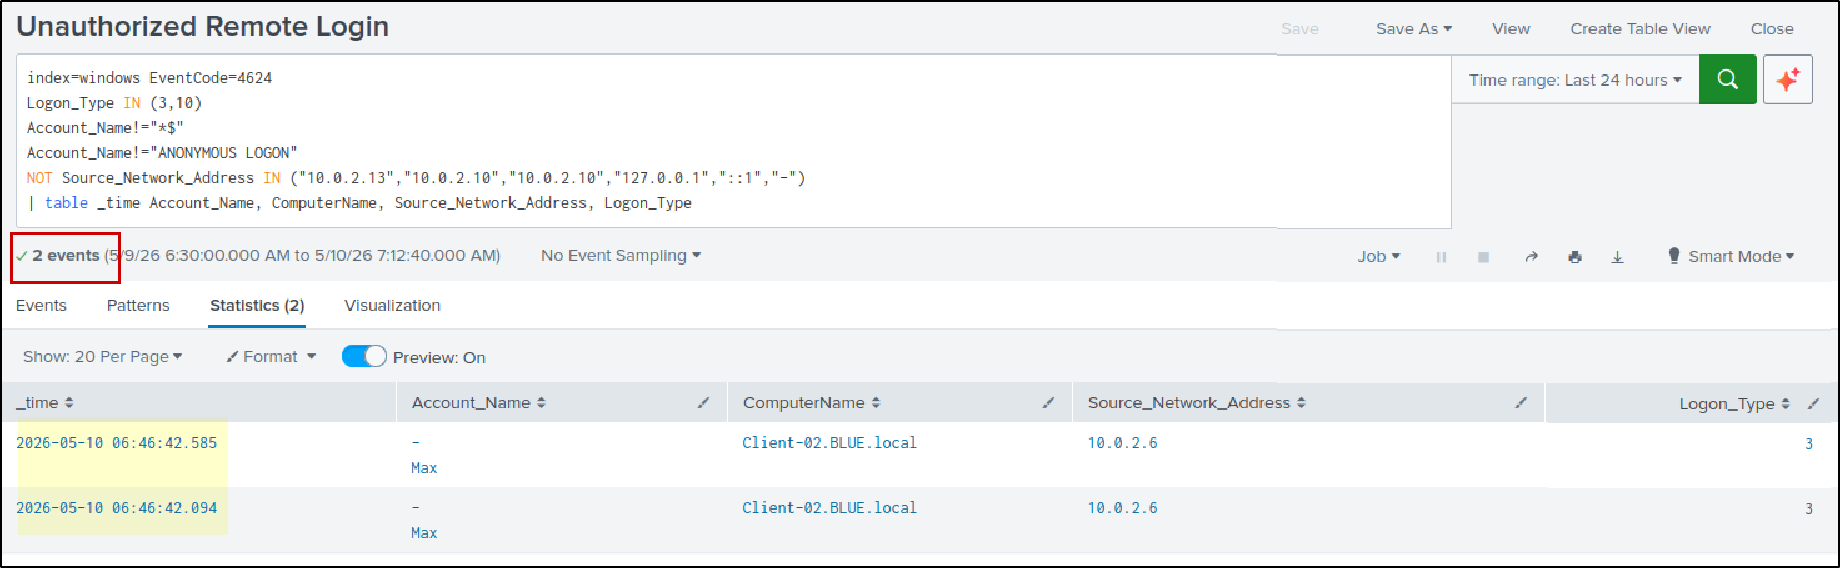
This query detects successful logins from IP addresses other than the trusted/allowed IPs listed in the query.
1
2
3
4
5
6
index=windows sourcetype="WinEventLog:Security" EventCode=4624
Logon_Type IN (3,10)
Account_Name!="*$"
Account_Name!="ANONYMOUS LOGON"
NOT Source_Network_Address IN ("10.0.2.13","10.0.2.10","10.0.2.10","127.0.0.1","::1","-")
| table _time Account_Name, ComputerName, Source_Network_Address, Logon_Type
After confirming the query detected the simulated activity successfully, click Save As → Alert at the top-right corner. 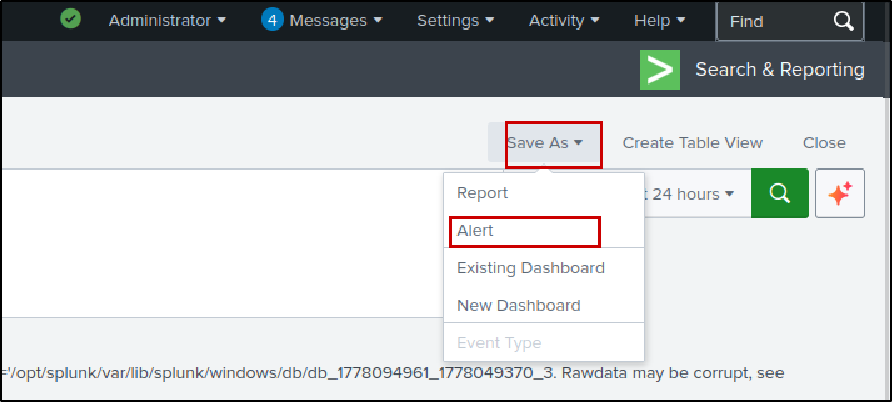
Then, based on what the query is detecting, give the alert an appropriate name and description so it is easy to understand later during investigations or monitoring.
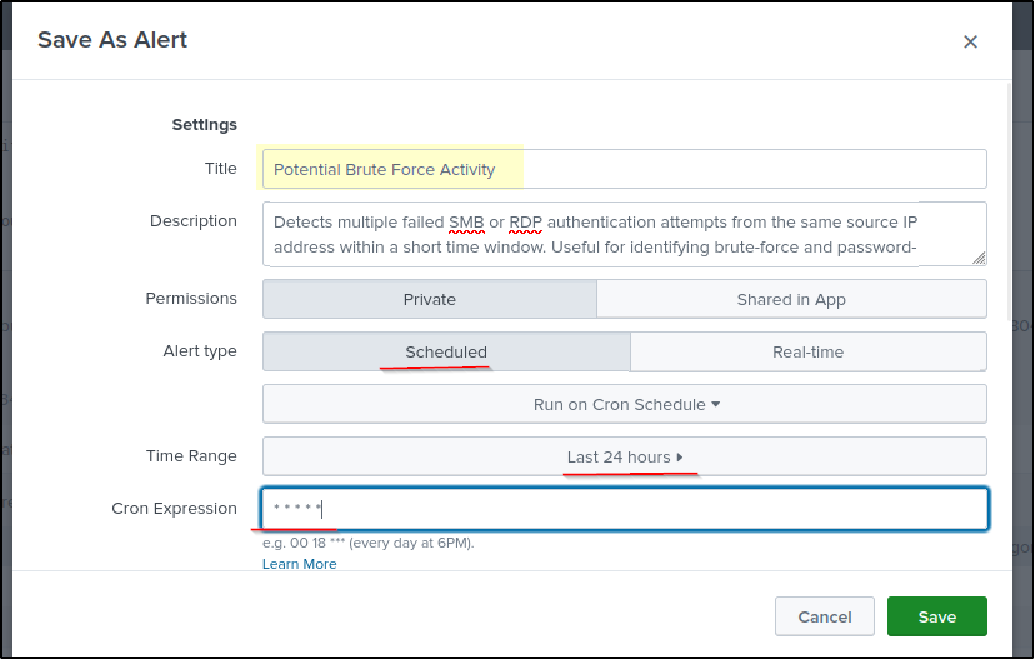
Now you can fill the details depending on your environment and detection needs: environment size, log volume, how quickly you want alerts to trigger.
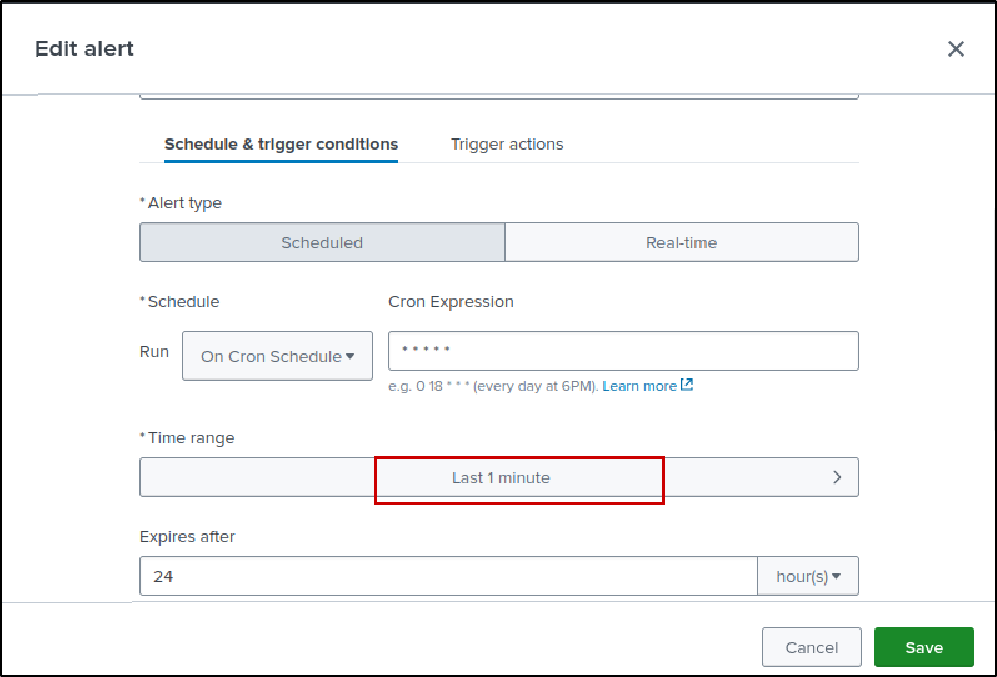
For this Lab. I chose: Alert type = scheduled → Splunk automatically runs the query at specific intervals.
Time Range= Last 24 hours -> Searches logs generated within the last 24 hours.
cron expression: * * * * * → Runs the query every minute to quickly detect suspicious activity.
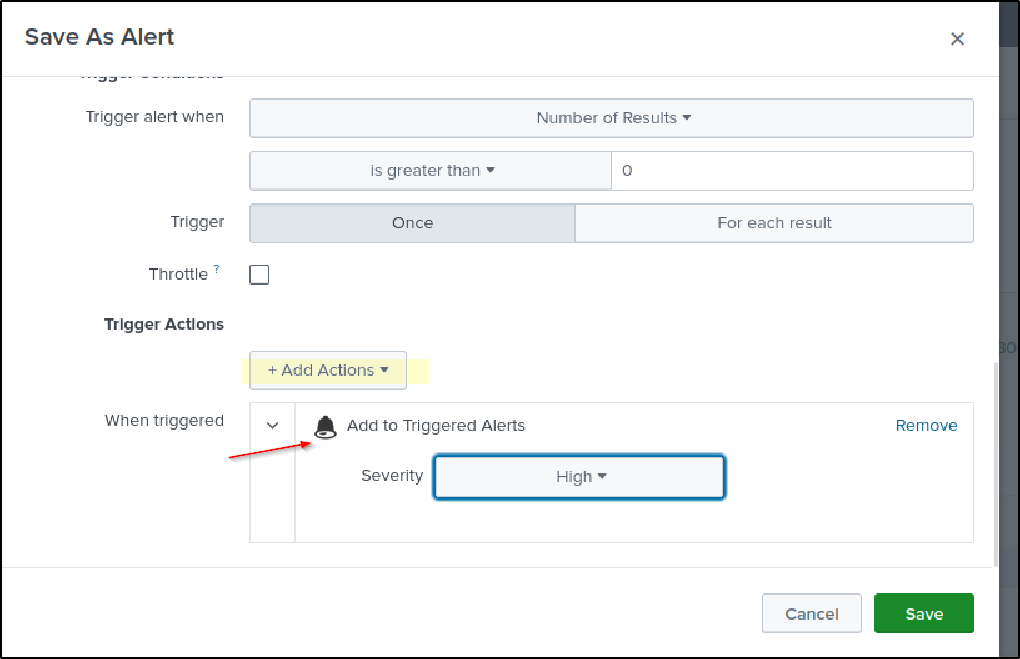
Under the Trigger Actions section:
- choose Add to Triggered Alerts
- Choose the alert severity level
- save the alert
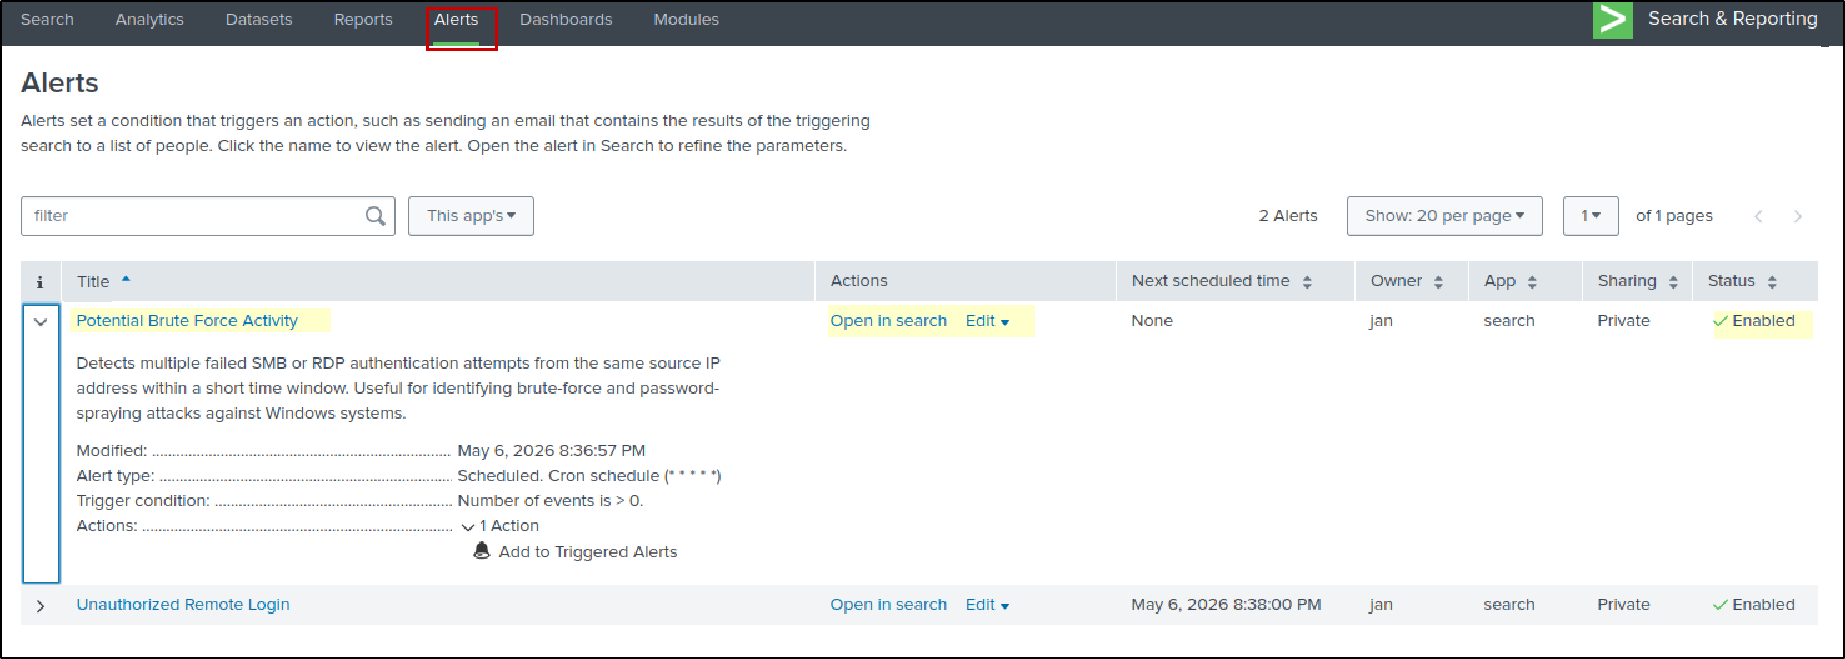
Under the Alerts tab, we can see all alerts we created. From there, we can edit alert settings, enable or disable alerts, and modify schedules or trigger conditions. If you click Open in Search, Splunk reruns the saved query and displays the matching event details again.
Testing and Validating Alerts
To test the detections again, I performed another brute-force attack, but this time targeted a different user on another host called CLIENT-02 to verify whether the alerts still detected the activity. 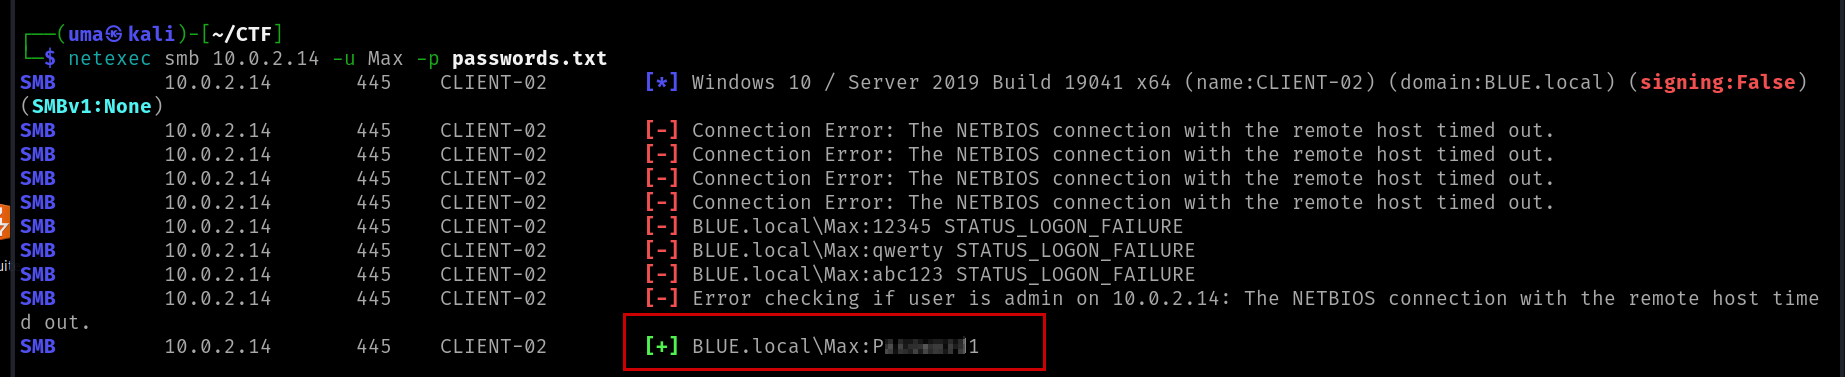
However, when I checked the Triggered Alerts tab, I initially did not see any triggered alerts.
So I started troubleshooting step-by-step:
Verified whether the brute-force and access events were actually logged. Confirmed the events existed in Splunk.
Checked whether both alerts were enabled ( I disabled one during other home lab, so enabled it again)
Opened the alert using
Open in SearchThen started modifying the query to detect the above activity. when i removed ‘sourcetype="WinEventLog:Security"
the query started returning results again. I then saved the updated alert.
Next, I checked Triggered Alerts. At this point, I noticed something important: Since the alert was configured to search the last 24 hours and run every minute. Splunk kept generating new alerts every minute for the same events.
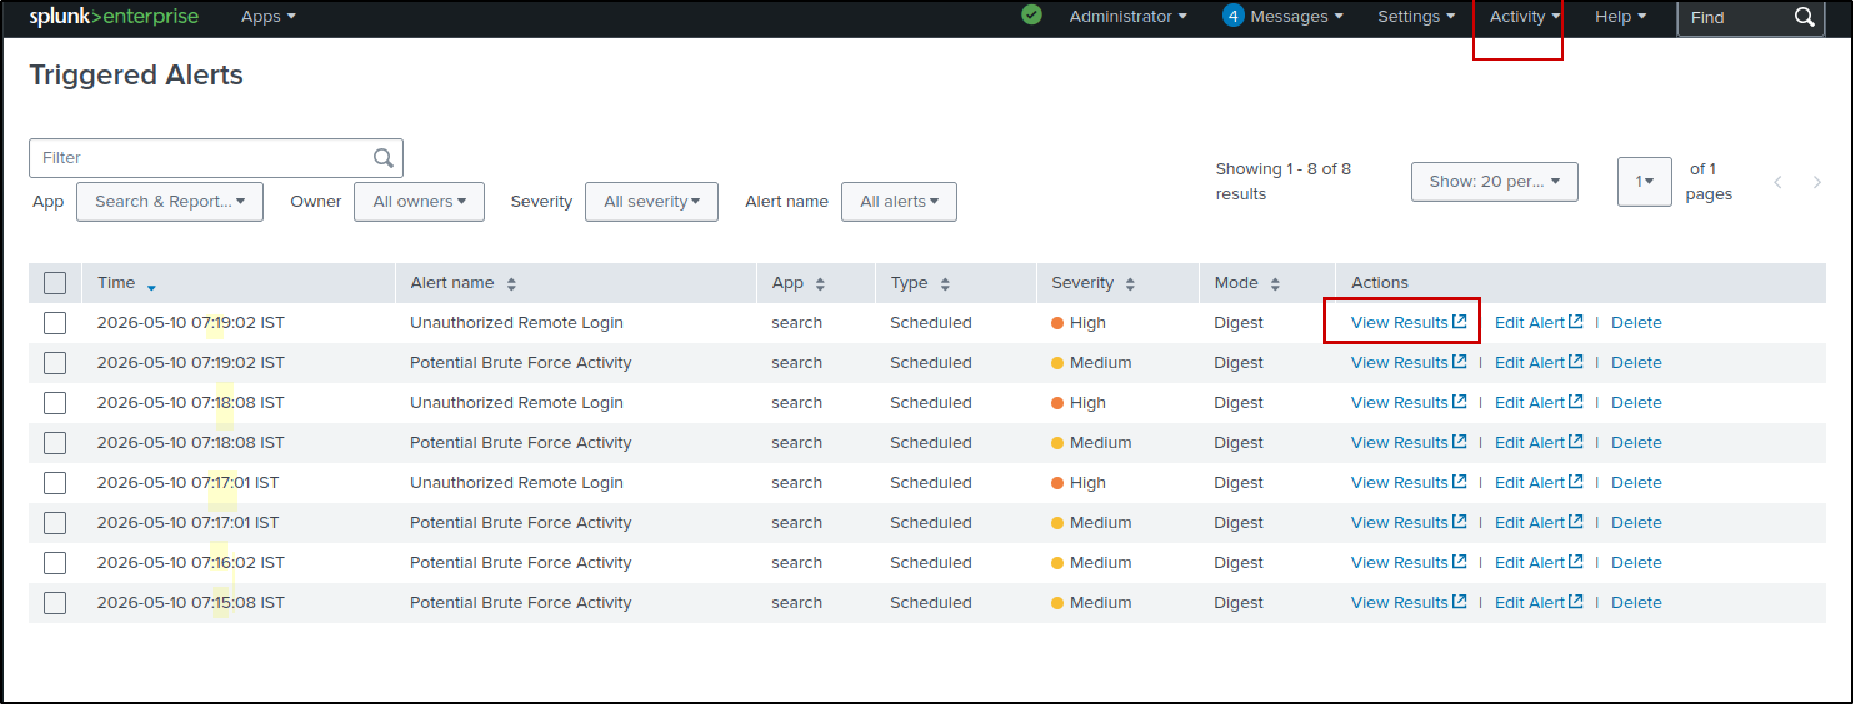
At first, I thought Splunk would generate only one alert for the same activity. However, because the matching events still remained within the 24-hour search window, the alert continued triggering every minute whenever the scheduled query ran again.
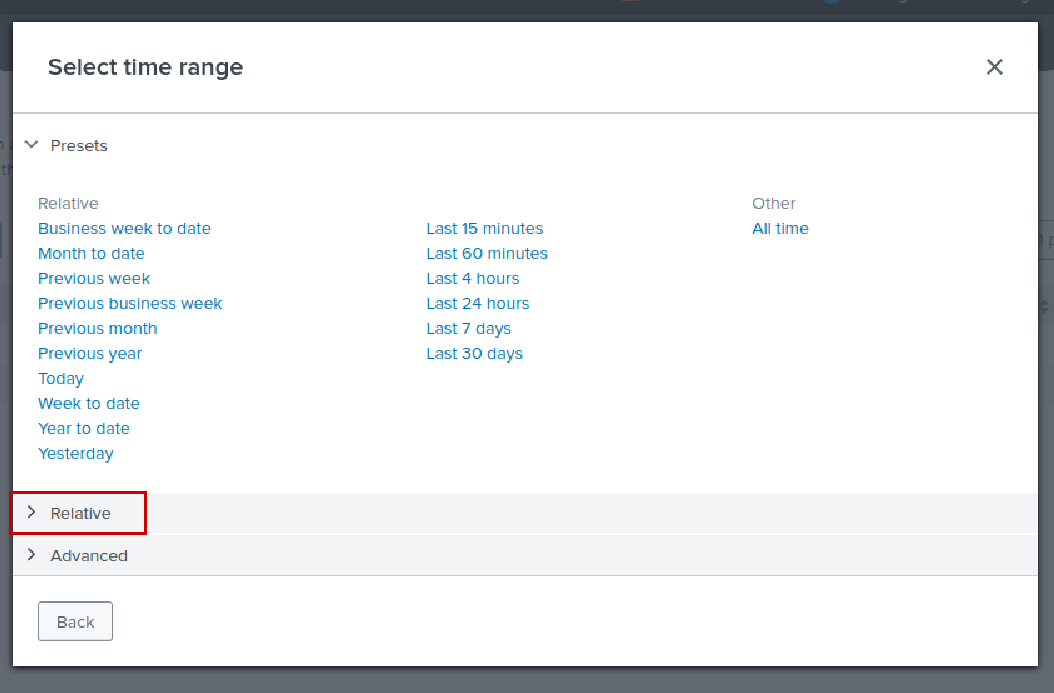
To fix this, I changed the alert time range from: Last 24 hours to: Last 1 minute To do this, go to edit alert. In the Time Range field, select the time picker. Since the Presets section does not include a Last 1 minute option in this Splunk version, go to the Relative section instead.
 Then configure the time range by setting to “1 minute ago to Now”
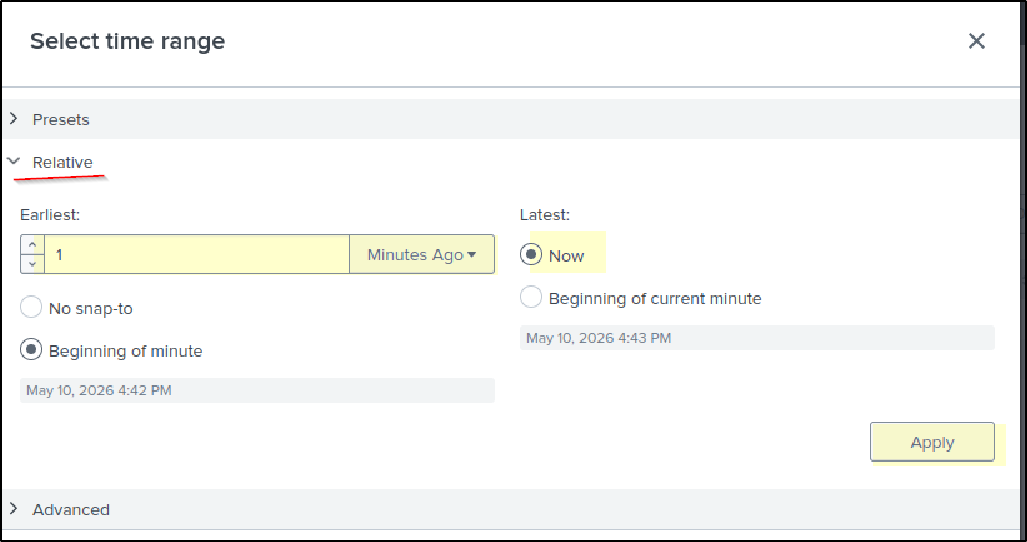
This tells Splunk to search only the logs generated within the last 1 minute. Since the cron job is also configured to run every minute, Splunk checks only newly generated events each time the alert runs. This reduced duplicate alerts significantly.
After configuring the values, click Apply, confirm the changes, and save the alert again.
Lessons Learned
Always validate and test your detection rules and alerts after creating them.
Even small filters or incorrect time ranges can prevent alerts from triggering correctly or can generate excessive duplicate alerts.